Chapter 1 — Environment, ecology and systems thinking
Exam link: common foundation; environmental coverage is supplementary unless a later AP SLPRB notice specifies it.
Learning aim: distinguish environment, ecology, ecosystem, habitat, population, community and biome; use a system boundary to explain how one change can travel through a landscape.
1.1 Why ecology is a way of reasoning
The word *environment* describes the surroundings and conditions that affect an organism or a human community. These surroundings include physical conditions such as temperature, water, soil and light; living organisms; and human-built conditions such as roads, farms, settlements and industries. What counts as “the environment” depends partly on the question. If we ask why a fish population changes in a lake, water quality, food availability, predators, fishing and lake-level management may matter. If we ask whether a coastal road alters drainage, the relevant surroundings include dunes, channels, settlements and the sea. The word is broad; it does not name one single subject.
*Ecology* is the study of relationships among organisms and between organisms and their surroundings. It asks questions about mechanisms: what resources are available, which organisms use them, how they interact, and how conditions change across space and time. Ecology is not the same as environmental protection. Ecology supplies concepts and evidence; conservation, pollution control and land-use decisions are practical responses that also involve law, economics, ethics and public institutions.
An *ecosystem* is a working unit formed by organisms interacting with one another and with the non-living conditions in a defined area. It can be a small pond, a mangrove creek, a crop field, a grassland, a city park or a much larger landscape. A boundary is useful for analysis, but it is not a wall. Water, organisms, nutrients, pollutants and people move across it. A creek is connected to its catchment; a wetland receives runoff; a forest patch may be connected to a corridor. A good ecology answer therefore asks: where did the matter, energy or organism come from, and where can it go next?
1.2 Levels of organisation
Ecological levels describe different kinds of questions. They are not just a ladder of bigger places; each level requires a different unit of observation.
- An organism is one individual living thing. A field study may examine how one mangrove seedling tolerates salinity.
- A population is a group of individuals of the same species living in a defined area at a stated time. Counts require a clear area and method. A number without these details is difficult to compare.
- A community is the set of populations of different species that occur and interact in an area. It may include plants, animals, fungi and microorganisms.
- An ecosystem includes the community and the physical environment with which it exchanges energy and matter. Nutrients in water and sediment are part of the system even though they are not organisms.
- A landscape is a mosaic of connected ecosystems or habitat patches. It helps explain movement, fragmentation and flows between a forest, farm, river and settlement.
- A biome is a broad ecological region associated with characteristic climate and vegetation patterns. A biome is not one uniform habitat; it contains local variation and many ecosystems.
There is no universal size for an ecosystem. The relevant size follows from the question and the flows being studied. A pond can be a useful ecosystem for a food-web investigation. For flood risk or nutrient movement, the catchment around the pond may be the more useful system. Choosing a boundary that omits a major inflow can produce a neat but wrong explanation.
Worked system-boundary example: a lagoon and its catchment
Suppose fish numbers in a lagoon decline after a season of unusually heavy rain. “Rain caused the decline” is not yet a complete explanation. A systems analysis first separates observations from possible mechanisms. Rain can alter freshwater inflow and salinity. Runoff may carry soil, nutrients or contaminants. A high water level can change access to refuge habitat. The same season may also change fishing effort or water exchange. Each pathway requires evidence. A salinity reading, dissolved oxygen measurement, land-use map, fish survey and record of fishing effort answer different parts of the question; one measurement does not prove every pathway.
The example also shows why a correlation is not automatically a cause. The timing of rainfall and fish decline makes a hypothesis plausible, but a competing explanation may be possible. A useful field investigation measures the suspected mechanism, records its timing, compares locations or periods, and identifies other changes. Exam questions often test this discipline through a short case: select the conclusion supported by the evidence, not the strongest-sounding story.
1.3 A coastal-to-inland view of Andhra Pradesh
Andhra Pradesh offers a useful way to picture ecological connections. A simplified teaching transect can move from the Bay of Bengal coast through estuarine and wetland settings, cultivated plains and river corridors toward upland and Eastern Ghats landscapes. This is a conceptual route, not a claim that every listed habitat lies in one straight line or occurs in every district. The point is that water, sediment, organisms and human activity connect places that a district map might separate.
At the coast, waves, tides and storms shape shoreline conditions. Where freshwater meets seawater, salinity changes over distance and time. Estuaries can support organisms adapted to this gradient. Mangrove roots slow water locally and provide structure, but the ecosystem's condition also depends on tidal exchange, sediment, freshwater flows and land use beyond the stand. Wetlands vary with season: a shallow basin may expand in the rainy period and contract in a dry period. A river carries water and sediment downstream; a road, embankment or drainage channel can redirect those flows. Inland, vegetation and soils influence infiltration and runoff, while farms and settlements change water demand and the movement of nutrients.
This connected view avoids two errors. First, it avoids treating a habitat as isolated from its catchment. Second, it avoids treating one species or land cover as a complete measure of ecological health. A place can retain visible greenery while losing a seasonal water connection; a wetland may remain wet but change in water quality or species composition. Different indicators reveal different features.
Figure 1.1 — AP coast-to-upland ecological transect: draw a labelled, not-to-scale cross-section with coastal water, estuary/mangrove edge, wetland, cultivated plain, river corridor and upland/ghat slope. Add arrows for freshwater, tidal influence, sediment, organism movement and human-built barriers. Caption must state that habitats are generalized and not to district scale.
1.4 Components and flows
Every ecosystem contains living components and physical conditions. Living components include organisms that capture energy, organisms that consume other organisms or organic matter, and decomposers that transform dead material and waste. Physical conditions include water, light, temperature, dissolved substances, soil or sediment, salinity and topography. Which conditions matter most depends on the organism and the question. Salinity may strongly affect estuarine organisms; light may govern plant production in a shaded water body; dissolved oxygen may be central to a fish-kill investigation.
Energy and matter behave differently. Energy enters many ecosystems as sunlight, is captured by photosynthetic organisms and moves through feeding relationships. At each transfer, a portion becomes unavailable for the next transfer, much of it dissipating as heat. Matter—such as carbon, nitrogen and water—can be transformed and reused through ecological and physical processes. It may move beyond the study boundary, but it is not created anew by each organism. This contrast is fundamental: energy flows through an ecosystem, while materials cycle among organisms and the physical environment.
These statements do not imply a perfectly closed cycle. A real wetland receives or exports water and sediment. A farm imports fertiliser and exports crops. A forest patch may receive seeds from elsewhere. The system model is a tool for asking what enters, what leaves, what is stored and what changes internally. It is not a claim that nature forms a sealed container.
1.5 Drivers, pressures, states and responses
When describing environmental change, separate four stages. A driver is a broad activity or force, such as expanding settlement or a changing climate. A pressure is the direct stress imposed on a system, such as land conversion, nutrient loading or water extraction. State describes the resulting condition being measured, such as habitat extent, water quality or population size. A response is an action intended to reduce pressure or improve condition, such as restoring a channel, changing a discharge practice or protecting a corridor.
The stages help students avoid jumping from a broad cause to an unmeasured result. “Urban growth harms biodiversity” is too general for a precise case answer. A better account identifies the pathway: new built surfaces may increase rapid runoff; drainage works may change water movement; habitat patches may become smaller or disconnected; these changes can affect some species. The outcome depends on local design, species, season and other pressures. If the question supplies evidence only about habitat area, do not claim it has proved a population decline unless that was measured.
1.6 Reading an ecological case in an exam
Use a short sequence when you face a statement question or data snippet:
1. Identify the ecological unit: organism, population, community, ecosystem or landscape.
2. Mark the system boundary and list important inputs, outputs and connections.
3. Separate living components from physical conditions.
4. Trace the proposed mechanism one step at a time; check the direction of every arrow.
5. Distinguish the measured result from an inferred cause.
6. Look for the scale and time period. A seasonal change is not necessarily a permanent trend.
7. Choose only the conclusion supported by the stated evidence.
Consider a chart showing lower dissolved oxygen and fewer fish at one sampling site than at another. It supports a spatial association between the measurements. To establish why they differ, additional evidence is needed: temperature, flow, organic load, sampling time and comparable survey methods may matter. If a question asks which measured variable is most directly relevant to fish stress, dissolved oxygen is pertinent. If it asks what caused the difference, the chart alone may not settle the cause. The wording of the question controls how far the evidence allows you to go.
1.7 Common confusions
Environment versus ecology: environment means surroundings and conditions; ecology studies relationships within and around living systems. Community versus ecosystem: a community contains interacting populations; an ecosystem also includes physical conditions and exchanges. Habitat versus niche: habitat is the place or setting an organism occupies; niche concerns its way of life, resource use and relationships. Biome versus ecosystem: a biome is a broad regional pattern; an ecosystem is a functional unit defined for a particular analysis. Conservation versus ecology: conservation is action and governance informed by ecology and other fields. Green appearance versus health: visible plant cover alone may not show water quality, connectivity, soil condition or species composition.
Retrieval check
Without looking back, explain why a lagoon is not an isolated ecosystem; distinguish a population from a community; name one energy flow and one material cycle; and state why a measured association does not prove a cause. Then draw a system boundary around a familiar pond or stream and list two inputs, two outputs and one important measurement you would need before making a claim about its condition.
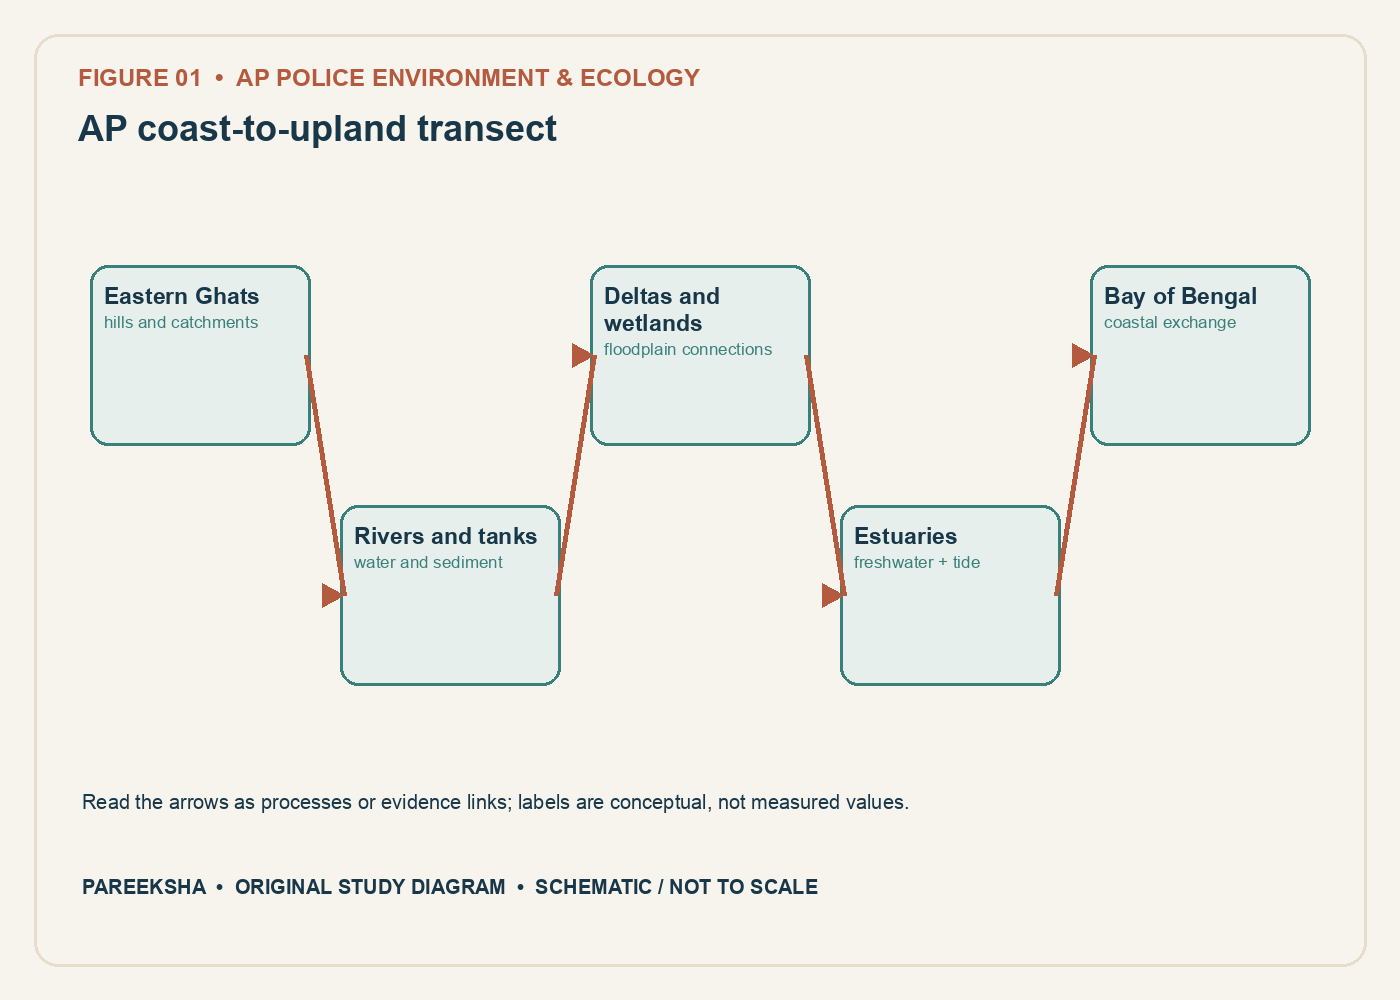
Figure 1.1 AP coast-to-upland transect. Original explanatory diagram; schematic and not to scale.
Chapter practice questions
1. A researcher marks the boundary of a small pond, then records water, light, algae, insects, fish and microbial decomposers. Which description best fits the pond as studied?
A. An ecosystem, because organisms and abiotic conditions are considered together
B. A population, because several organisms share one location
C. A biome, because every pond has the same climate
D. A community, because water is a living component
Answer: A. An ecosystem includes interacting organisms and abiotic conditions within a chosen boundary. A community contains populations of organisms but excludes the physical environment.
2. A field team counts every frog of one species at a wetland during a defined survey period. The set being studied is a:
A. Biome
B. Population
C. Community
D. Food web
Answer: B. A population is a group of individuals of the same species in a defined area and time. The area and survey period make the count interpretable.
3. Which sequence moves from the smallest listed ecological level to the largest?
A. Population → organism → ecosystem → community → biome
B. Organism → community → population → biome → ecosystem
C. Organism → population → community → ecosystem → biome
D. Community → population → organism → ecosystem → biome
Answer: C. An organism belongs to a population; populations form a community; a community interacting with its physical environment is an ecosystem. A biome covers broad regions with characteristic climate and life forms.
4. A study finds that fish abundance rises in years when water temperature is higher. Which conclusion is most scientifically careful?
A. Higher temperature is proven to be the sole cause of more fish
B. Temperature cannot affect fish because it is abiotic
C. The association proves that fish cause warmer water
D. Fish abundance and temperature are associated, but other causes should be tested
Answer: D. Correlation identifies a pattern, not a complete causal explanation. Food, oxygen, flow, fishing pressure and sampling differences may also influence abundance.
5. Which item is an abiotic factor in a mangrove ecosystem?
A. Salinity of the tidal water
B. A crab feeding on detritus
C. A mangrove seedling
D. A bird nesting in a tree
Answer: A. Salinity is a non-living chemical condition. The crab, seedling and bird are organisms and therefore biotic components.
6. Why should an ecologist state the boundary of a study system?
A. It fixes the result so later measurements cannot change
B. It clarifies which inputs, outputs and interactions are included
C. It proves that organisms outside the boundary have no effect
D. It removes seasonal variation from the data
Answer: B. A boundary makes the question measurable and shows what crosses into or out of the system. It does not make outside influences disappear.
7. A nutrient enters a lake, is taken up by algae, passes to consumers and later returns through decomposition. This movement is best described as:
A. A one-way energy flow with no recycling
B. A trophic level becoming a biome
C. Matter cycling through ecosystem compartments
D. A population turning into an abiotic factor
Answer: C. Nutrients are matter and can move among organisms and physical pools. Energy flows through trophic transfers and is dissipated as heat rather than recycled in the same way.
8. Which statement best distinguishes a community from an ecosystem?
A. A community is always larger than a biome
B. An ecosystem contains only non-living components
C. A community is one organism and an ecosystem is one species
D. A community includes interacting populations; an ecosystem also includes abiotic conditions
Answer: D. Community refers to the interacting populations in an area. Ecosystem adds the physical and chemical environment and its interactions with organisms.
9. An ecologist follows the same marked grassland plots each year after a fire. What does this repeated design chiefly help reveal?
A. Change through time at those plots
B. The exact future climate of the whole state
C. That every fire has an identical effect
D. The total biodiversity of the entire Eastern Ghats
Answer: A. Repeated observations help document temporal change at the sampled locations. Extrapolation to a larger region or to every fire requires additional representative evidence.
10. Which example is a biological interaction rather than an abiotic condition?
A. Day length
B. Competition between two plant species for light
C. Soil pH
D. Seasonal rainfall
Answer: B. Competition is an interaction between organisms. Day length, soil pH and rainfall are abiotic conditions.
11. A wetland map is used to compare water spread between two years. Which detail is essential before interpreting the difference?
A. The colour chosen for the title
B. The number of pages in the report
C. The map’s date, scale, method and season
D. The district headquarters’ population
Answer: C. Wetland extent varies seasonally and map methods can differ. Date, scale, classification method and season are needed for a fair comparison.
12. Which item is an ecosystem process rather than an ecosystem component?
A. A fish population
B. Dissolved oxygen
C. A wetland’s physical boundary
D. Decomposition of leaf litter
Answer: D. Decomposition is a process carried out by organisms and physical-chemical conditions. Fish, dissolved oxygen and boundaries are components or descriptors.
13. Why is “the coast” too broad a label for a precise ecological comparison?
A. It can include beaches, estuaries, lagoons, dunes and mangroves with different conditions
B. Every coastal location has the same species and salinity
C. Coastal habitats have no seasonal changes
D. Coastal systems are always isolated from rivers
Answer: A. The coast contains multiple habitat types and gradients. A useful comparison identifies the specific habitat and relevant conditions.
14. A team observes many dead fish after a storm. What is the best first interpretation?
A. The storm proves that climate change caused the deaths
B. The event is an observation that calls for investigation of possible mechanisms
C. The fish must have died from one pollutant
D. A single event establishes a long-term population trend
Answer: B. The observation is important but does not establish cause. Oxygen, salinity, temperature, contaminants, disease and physical disturbance can be investigated.
15. Which statement about ecological scale is correct?
A. A result at one site automatically applies to every district
B. Local measurements are never useful
C. The appropriate scale depends on the question and the process being measured
D. Regional patterns cannot be built from site observations
Answer: C. Scale should match the question. Site data can be valuable, but regional claims need suitable sampling and synthesis.
16. A river carries sediment from uplands to a delta. This example most directly shows that:
A. A delta is a closed system without external inputs
B. Sediment is energy rather than matter
C. Only organisms connect landscapes
D. Ecosystems can be connected by flows across boundaries
Answer: D. Water and sediment move between landscape units, connecting catchment and delta processes. Sediment is matter, and physical flows also connect ecosystems.
17. Which is the strongest way to compare two habitat surveys?
A. Use comparable methods, defined areas and dates, and report limitations
B. Compare raw counts even if area, season and method differ
C. Select whichever result supports the preferred conclusion
D. Ignore detectability because all species are equally easy to find
Answer: A. Comparable effort and explicit metadata make the comparison more defensible. Detectability and method differences can otherwise create apparent changes.
18. In systems thinking, a feedback occurs when:
A. A researcher writes the result in a notebook
B. An output influences a later input or process in the same system
C. A species is given a scientific name
D. An ecosystem is divided into chapters
Answer: B. Feedback describes a loop in which consequences affect later system conditions. It may amplify or reduce change depending on its direction and mechanism.