Chapter 18 — Integrated ecology, field evidence and exam practice
Learning aims
Combine ecological mechanisms, data interpretation, law and local context; identify the difference between evidence and inference; and answer unfamiliar environment questions without relying on a memorised slogan.
18.1 A repeatable method for unfamiliar questions
Environment questions often combine several subjects. A lake question may require geography, nutrient cycles, ecology, pollution, law and data interpretation. Use this sequence:
1. Classify the system. Is it terrestrial, freshwater, coastal, marine, atmospheric, urban or a connected landscape?
2. Identify the process. Is the question about energy flow, matter cycling, population change, pollution transport, climate forcing, or governance?
3. Name the evidence. Is it a measurement, a map, a law, an official date, an experiment, or a model result?
4. Check the scale and time. Local or regional? One season or a long trend? A current rule or an older statute?
5. Trace cause and effect. Separate pressure, pathway, receptor and consequence.
6. Test each option. A choice can contain one correct clause and one false overstatement. Look for words such as always, only, entirely, automatically and all.
7. State uncertainty honestly. A plausible mechanism is not proof that the effect occurred at a particular site.
18.2 Read charts before reading claims
For any graph, check its title, axes, units, time period, source and denominator. A rise in total renewable capacity is not the same as a rise in the renewable share of electricity generated. A percentage increase from a small baseline may still be small in absolute terms. A falling annual average can hide a short pollution episode. A national average can conceal local exposure.
For a time series, ask whether the measurement method or station changed. For a map, check date, scale, projection, legend and boundary authority. For a table, distinguish “not reported” from zero. In multiple-choice questions, an option that ignores these basics may be wrong even when it repeats a headline number.
Worked data example: a lake receives nutrient-rich runoff
Suppose monitoring shows rising nitrate and phosphate near an inflow, reduced water transparency, and an increase in algal biomass. This pattern is consistent with nutrient enrichment and possible eutrophication. It does not, by itself, identify the exact source, prove that nutrients caused every fish death, or establish the lake-wide trend. A stronger investigation samples upstream and downstream, includes seasonal repetitions, measures dissolved oxygen at different depths and times, and compares other possible stressors such as temperature, toxic contaminants and flow changes.
The causal chain is: nutrient input → increased primary production → algal bloom or dense growth → decomposition and oxygen demand → low dissolved oxygen in susceptible conditions → stress or mortality in aquatic organisms. The chain is conditional. Nutrient limitation, mixing, temperature, light and residence time affect the outcome. The exam skill is to recognise the mechanism without overclaiming that it must happen identically in every lake.
18.3 Build a causal diagram, not a memorised list
Take coastal erosion. Potential drivers include waves, sediment supply, sea-level change, storms, structures that interrupt sediment movement, and shoreline engineering. The observed shoreline response depends on local geomorphology and time interval. A seawall may protect one asset while increasing erosion elsewhere; a beach nourishment project may work temporarily and require repeated maintenance. Avoid single-cause answers where the system has interacting drivers.
Take urban heat. Surface materials, shade, building density, traffic heat, ventilation, water bodies and weather interact. Tree planting can provide shade and evapotranspiration but requires appropriate species, root space and water. A tree-count target alone cannot establish cooling, survival or equitable shade access. Monitoring should measure canopy cover, surface or air temperature, survival and distribution by neighbourhood.
18.4 Separate hazard, exposure and vulnerability
A hazard is a potentially damaging event or condition. Exposure describes people, infrastructure or ecosystems in harm’s way. Vulnerability describes how susceptible they are and how well they can cope. Risk depends on all three. A cyclone hazard does not cause the same loss in every settlement: elevation, housing, warning access, evacuation routes, age, disability, livelihood and protective ecosystems matter.
Environmental risk reduction therefore combines hazard information, exposure mapping, social vulnerability, preparedness and ecosystem management. A wetland may reduce some flood impacts, but the level of protection varies with location, condition and event magnitude. Do not substitute a general ecosystem service claim for local engineering or evacuation planning.
18.5 Law and science answer different questions
Science can estimate what is happening, how a process works, and how confident an inference is. Law identifies duties, jurisdiction, procedures, standards and remedies. A monitoring result can show an exceedance; the applicable standard and legal process determine what response is required. A designation can identify a protected category; the Gazette notification defines the legal area and restrictions. Keep these layers distinct in answers.
When a question names a rule or Act, verify its exact title, year, amendment and effective date. If an amendment applies only in certain territories or depends on an enabling notification, do not assume it has nationwide application. When the question asks for a current list or status—such as sites, species schedules, targets, or notified zones—include a “as on” date in your notes and use a primary source.
18.6 Three integrated Andhra Pradesh cases
Case A: nutrient load into a wetland
Residents report that a wetland has more algal growth after a new upstream discharge. Prepare a testable plan: map discharge and inflow points; collect seasonal upstream/downstream nutrient and dissolved-oxygen samples; document rainfall and water level; compare with the pre-project baseline; identify other sources; inspect consent and clearance conditions; and publish the results. Do not treat temporal coincidence as proof of sole causation.
Case B: road alignment across a wildlife landscape
The project proposes two alignments, one shorter but crossing a forest patch and one longer near existing development. Compare fragmentation, traffic mortality, noise, community access, drainage, and induced land-use change. Use species-specific field evidence and seasonal survey design. Mitigation hierarchy: avoid the sensitive route if feasible; minimise crossing impacts; restore disturbed areas; offset only residual impacts where law allows and ecological equivalence is defensible. A generic animal crossing is not sufficient if it is in the wrong place or unusable by the focal species.
Case C: coastal development and mangroves
Before accepting “no impact,” map tidal channels, mangrove extent, sediment movement, project footprint and local fishing use. Establish a multi-season baseline. Examine whether the proposal changes tidal exchange or water quality, whether construction blocks a channel, and whether cumulative shoreline works are considered. Tie monitoring to measurable triggers and corrective action. A planting commitment cannot compensate automatically for loss of mature habitat or altered hydrology.
18.7 Exam revision map
Topic | Ask yourself | Frequent trap |
Ecosystem | What is the boundary and what crosses it? | Treating a system as closed |
Food web | Where does energy enter and where is it lost? | Treating matter and energy as identical |
Biodiversity | Which level: genes, species or ecosystems? | Calling every species count an index |
Pollution | What is the source–pathway–receptor chain? | Naming a pollutant without its route or effect |
Climate | Is the claim about weather, climate, forcing or impact? | Confusing capacity with generation |
Conservation | What designation, authority and boundary? | Interchanging sanctuary, Ramsar, ESZ and biosphere labels |
Law | Which version and effective date? | Using a draft as binding law |
Data | What units, period, denominator and source? | Treating missing values as zero |
18.8 Four-step answer discipline
1. State the central concept in one sentence.
2. Support it with the governing mechanism or primary fact.
3. Apply it to the named place, rule or dataset.
4. Exclude the tempting overstatement.
For example: “Eutrophication is nutrient enrichment that can increase primary production and oxygen demand. Whether it causes hypoxia depends on mixing, temperature, nutrient limitation and residence time. In a named lake, a causal claim requires repeated, spatially representative measurements. A single algal bloom observation does not prove the full lake-wide cause.”
Retrieval check
1. What is the difference between a hazard and a risk?
2. Name four metadata checks for a chart or time series.
3. Why is a monitoring correlation not sufficient to prove a single source caused a change?
4. Give one example where a law and scientific measurement answer different questions.
5. Why should a current environment fact include an “as on” date?
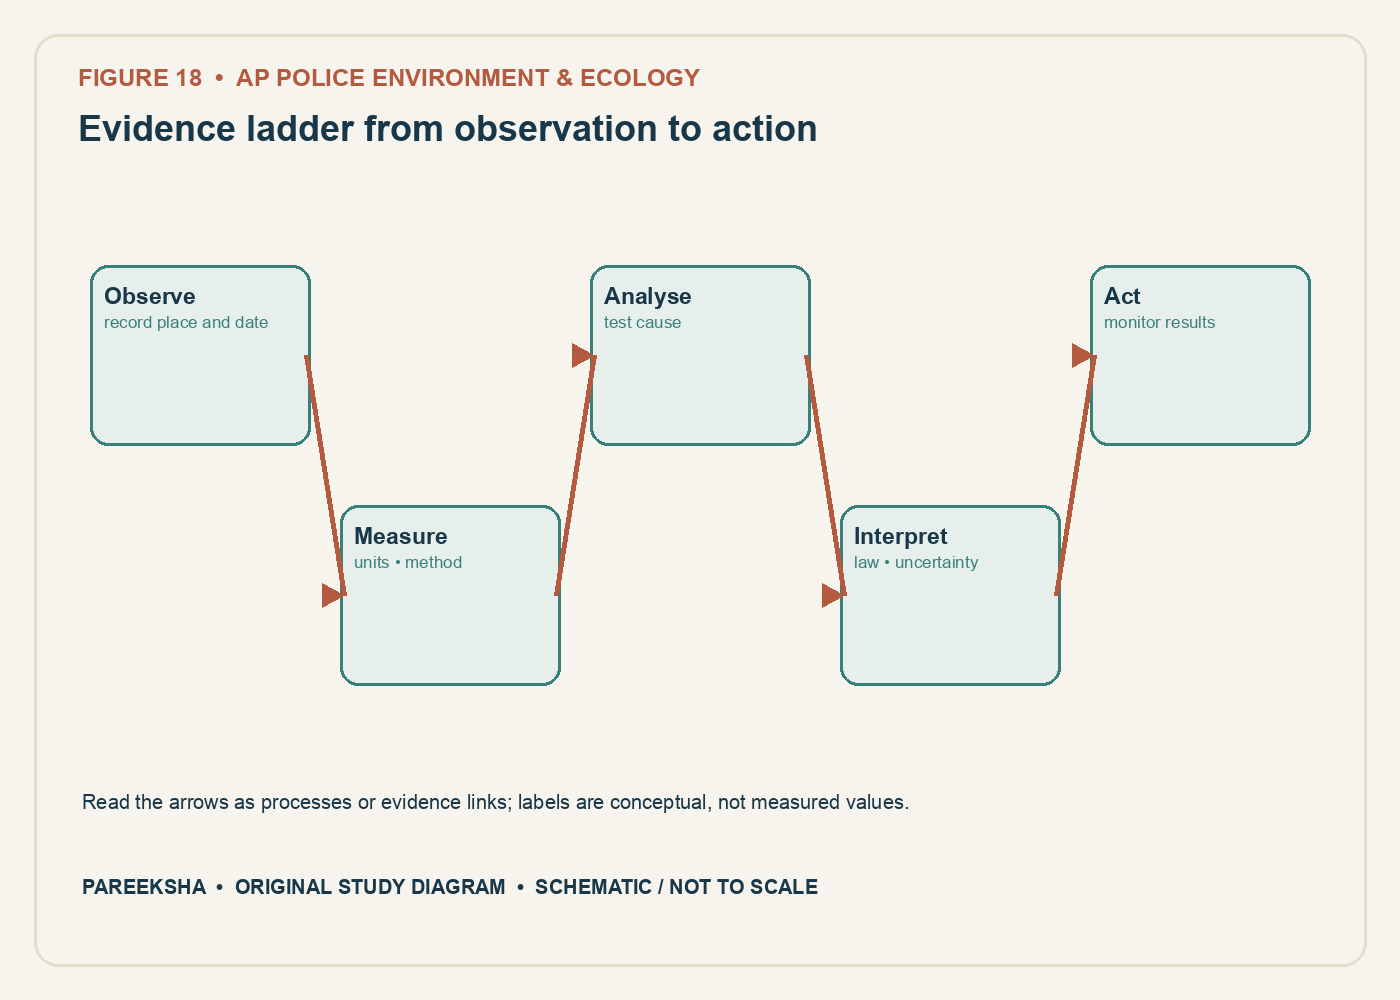
Figure 18.1 Evidence ladder from observation to action. Original explanatory diagram; schematic and not to scale.
Chapter practice questions
1. A graph shows algae increasing after nutrient concentration rises, but it includes only two dates. What is the strongest conclusion?
A. Nutrients have no possible role
B. The lake is permanently eutrophic
C. The pattern is consistent with nutrient enrichment, but two points do not establish a complete causal trend
D. The graph proves a single farm caused the change
Answer: C. The observations fit a plausible mechanism but provide limited temporal evidence. Repeated measurements and source analysis are needed to establish the pattern and cause.
2. A monitoring table lists a pollutant concentration but no units or sampling date. What is the main problem?
A. The pollutant is automatically safe
B. The concentration is a legal boundary
C. Units are unnecessary for measurements
D. The result cannot be reliably compared or interpreted without essential metadata
Answer: D. Units, date, location and method are needed to interpret the value and compare it with a standard. Missing metadata limits the claim.
3. A graph reports renewable installed capacity and electricity generated as the same percentage. Why might this be misleading?
A. Capacity is potential power capability; generation is actual energy produced over time
B. Both are measures of rainfall
C. Generation is always larger than capacity
D. Capacity includes only households
Answer: A. Installed capacity and generated electricity measure different quantities. Utilisation and resource conditions influence generation.
4. A fish-kill occurs after heavy rainfall near an industrial area. Which first step best supports causal analysis?
A. Name the nearest factory as the cause immediately
B. Build a source–pathway–receptor model and collect time-matched water, oxygen, weather and discharge data
C. Assume all fish kills have one cause
D. Measure only air temperature next month
Answer: B. A causal investigation should examine pathways and alternative explanations with timely measurements. Proximity alone does not prove a source.
5. A proposed road crosses a wetland’s seasonal feeder channel. Which impact pathway is most relevant?
A. The road changes the wetland’s Ramsar designation date
B. The road prevents all evaporation
C. The embankment may alter water movement and sediment transport
D. The feeder channel has no ecological function
Answer: C. A crossing can impede or redirect flow and sediment. Hydrological evidence should guide alternatives and mitigation design.
6. A map shows Kolleru’s boundary, but the legend says “approximate locator.” What is the correct use?
A. Treat it as a cadastral survey
B. Infer that all land within the outline is government-owned
C. Use it as a current court order
D. Use it to locate the wetland broadly, not to decide parcel-level legal status
Answer: D. A locator map is not a legal boundary instrument. Parcel status requires the relevant notification, official map and land records.
7. A field team records no otters in one afternoon survey. Which conclusion is justified?
A. The survey did not detect otters at that time; absence from the site is not proven
B. Otters are extinct in the district
C. Otters avoid every wetland
D. No further survey is needed
Answer: A. Non-detection is not equivalent to absence. Repeated surveys with appropriate timing and methods are required to estimate presence.
8. A waste audit records tonnes collected but gives no segregation or destination data. Which outcome remains unknown?
A. The amount collected, if measurement is valid
B. Whether waste was recovered, treated or safely disposed after collection
C. The city’s name
D. The audit year if printed in the table
Answer: B. Collection is one stage in the waste chain. The final processing and disposal outcome cannot be inferred without destination data.
9. A company reports that it planted 10,000 mangrove seedlings. What evidence would show ecological success more directly?
A. The purchase invoice alone
B. A photograph on planting day
C. Survival and natural regeneration over time with suitable tidal and sediment conditions
D. The number of volunteers at launch
Answer: C. Planting is an activity, not an outcome. Long-term survival, hydrology and ecological condition show whether restoration is functioning.
10. Two protected-area maps have different outlines for the same wetland. What should be checked first?
A. Which outline looks more attractive
B. Whether the map uses blue ink
C. Whether both maps have the same author initials
D. Whether they represent different designations, dates or boundary sources
Answer: D. Different legal or international designations may have different boundaries, and map dates or methods may differ. Identify the source and purpose before comparison.
11. A new discharge and increased algal growth occur in the same year. Which study design best tests whether the discharge contributed?
A. Compare upstream/downstream and before/after measurements across seasons, including other sources
B. Survey one downstream point once
C. Ignore flow and rainfall
D. Ask only whether algae are green
Answer: A. Spatial and temporal comparisons help test the relationship while accounting for other drivers. A single observation has weak causal power.
12. A forest block loses canopy after a fire. Which information is most useful for distinguishing recovery from conversion?
A. One satellite image without date
B. Repeated land-cover, field-vegetation and land-use records with consistent definitions
C. A national forest total only
D. A tourism website description
Answer: B. Multiple time points and field validation help distinguish temporary canopy loss and regrowth from lasting land-use change. Definitions should remain comparable.
13. An introduced species is found at one disturbed site. What additional evidence is needed before calling it invasive and harmful?
A. Its common name
B. The fact that it was not observed there fifty years ago
C. Evidence of establishment/spread and documented ecological or economic impact
D. A map colour
Answer: C. Non-native origin alone is not enough. Spread and impact should be supported by suitable records and context.
14. A flood-risk map shows a wetland as a protective feature. Which conclusion is most responsible?
A. Flooding is impossible wherever a wetland exists
B. The map replaces evacuation planning
C. Wetlands have no hydrological role
D. The wetland may reduce some flood impacts, but its effect depends on condition, location and event magnitude
Answer: D. Wetlands can store or slow some floodwater, but protection varies and extreme events can exceed capacity. Risk planning remains necessary.
15. A project’s EIA lists air emissions but no nearby schools or settlements. Which concern is strongest?
A. Receptors and exposure pathways may be inadequately described
B. The report has too many maps
C. Air emissions cannot affect people
D. Schools are never relevant receptors
Answer: A. An assessment should identify exposed receptors and pathways. Missing settlement information can make predicted effects difficult to evaluate.
16. A project’s public consultation record lists concerns about fishing access. What response would make the record more useful?
A. Delete the concern from the record
B. A reasoned answer explaining design changes, mitigation or why a concern was not accepted
C. Provide only a list of attendance signatures
D. Refer to a different district without explanation
Answer: B. A response matrix should connect concerns to considered actions or reasons. This enables transparent appraisal and follow-up.
17. A 2026 draft environmental notification is found online. What should a student say about its legal status?
A. It automatically applies from the comment deadline
B. It replaces the parent Act
C. It is a proposal unless and until a final instrument is notified and takes effect
D. It is a judicial order
Answer: C. Drafts are consultation documents, not final binding instruments. Check the final Gazette text and commencement provisions.
18. A cyclone causes erosion along one Andhra Pradesh beach. What evidence is required before attributing the erosion to climate change?
A. The storm’s name alone
B. A photograph from one day
C. A nearby mangrove count only
D. Event-scale coastal data and long-term trend analysis, accounting for sediment supply and shoreline structures
Answer: D. Attribution requires evidence about the event and long-term drivers. Sediment, structures, storms, sea-level change and local geomorphology can interact.
19. An NDC target is reported as “60% non-fossil electricity.” What correction may be necessary for India’s 2031–2035 NDC?
A. The target is about 60% of cumulative installed electric-power capacity, not actual generation
B. The target applies to forest cover only
C. The target is 60% of household connections
D. Capacity and generation are identical
Answer: A. The April 2026 NDC specifies about 60% cumulative installed electric-power capacity from non-fossil sources by 2035. This is not the same as the share of electricity generated.
20. Why should an environmental question about a statutory rule include the effective date?
A. Dates affect only book design
B. A later amendment or commencement date can change which text applies
C. A rule’s text never changes
D. The effective date is the same as every publication date
Answer: B. Enactment, publication and commencement can differ, and amendments may change the operative rule. The date identifies which legal version controls.
21. A wetland’s nitrate level rises after rainfall, while one upstream sample is also high. What is still needed to identify the dominant source?
A. One observation is conclusive
B. Rainfall cannot transport nutrients
C. More spatial and temporal sampling and possibly source-specific evidence
D. A legal designation alone
Answer: C. Runoff can move nutrients, but identifying the dominant source requires a broader sampling design and source evidence.
22. A biodiversity survey finds more bird species after a new road opens. Which interpretation is most cautious?
A. The road necessarily improved all biodiversity
B. No ecosystem changes after roads
C. Species richness identifies every population trend
D. Recorded richness increased, but effort, season, detectability and habitat change should be checked
Answer: D. The observed count may reflect genuine change or differences in survey conditions. Standardised methods and broader ecological measures are needed.
23. What does a dissolved-oxygen measurement represent most directly?
A. The oxygen present in water at the sampled place and time
B. The number of fish in a lake
C. The total annual rainfall
D. The amount of carbon stored in trees
Answer: A. Dissolved oxygen is a measured water-quality variable. A single reading does not by itself reveal the cause or long-term condition.
24. Which pairing of question and evidence is best matched?
A. “Is a rule in force?” — one photograph
B. “Did a population decline?” — repeated, comparable abundance surveys over time
C. “Where is a sanctuary boundary?” — an undated species count
D. “Did water quality change?” — a tourism brochure
Answer: B. Population trend requires comparable observations through time. Legal status and water-quality change need different, purpose-specific evidence.
25. Which statement best distinguishes ecological restoration from tree planting?
A. Restoration always means planting one species
B. Planting counts prove recovery
C. Restoration aims to recover ecological structure, composition and function; planting may be one tool
D. Restoration excludes hydrology
Answer: C. Restoration addresses ecosystem condition and processes, with methods tailored to the site. Planting may be unsuitable if underlying hydrology or causes of degradation remain.
26. A species is protected under a national schedule, but its habitat is outside a notified protected area. Which statement is correct?
A. The species loses protection outside the park
B. Site boundaries determine taxonomy
C. No conservation action is possible
D. Species protection and site designation are distinct legal tools that can both matter
Answer: D. Species-level legal protections and area-based designations are separate mechanisms. The specific Act and schedules govern species status.
27. A chart says forest cover rose but does not state the definition used. Which question should be asked?
A. What canopy threshold, mapping method, date and land category were used?
B. What colour is the chart title?
C. Who printed the page?
D. How many questions are in the book?
Answer: A. Forest statistics depend on definitions and methods. A valid comparison needs consistent categories and dates.
28. A final environmental decision includes a monitoring condition and a response trigger. Why is the trigger useful?
A. It guarantees there will be no impacts
B. It links measured performance to a defined corrective action
C. It replaces monitoring
D. It changes the project’s legal category automatically
Answer: B. A trigger specifies when action is required, making monitoring more actionable. It does not guarantee compliance or zero impact.