Chapter 4 — Productivity, ecological pyramids and cycles
Exam link: common foundation.
Learning aim: distinguish primary production from standing biomass, interpret ecological pyramids and trace matter through carbon, nitrogen and water pathways.
4.1 One ecosystem, several different measurements
Environmental questions often become confusing because they use words that sound similar but measure different things. Production describes the rate at which new organic matter is formed over time. Biomass describes the amount of living material present at a given time. Energy flow tracks energy transferred through processes. Abundance counts individuals. A chart comparing these quantities is meaningful only when units, area, time and sampling method are compatible.
For example, a productive marsh can have rapid plant growth during a wet season, yet a survey on one date may find only a moderate standing biomass because plants are grazed, die back or are transported. A single snapshot does not reveal the full annual production. Likewise, many tiny organisms may weigh less collectively than a few large ones, so counts and mass need not move together.
Primary production is often divided into gross and net terms. Producers capture energy and form organic compounds; some of that is used in their own respiration. The remainder is net primary production, available for growth, consumers and detrital pathways. If a problem supplies compatible values, the relation is:
> Net primary production = gross primary production − producer respiration
Check that all values use the same time interval and area. If a question gives a daily production rate and annual respiration total, convert units before subtracting. Avoid comparing wet mass with dry mass unless the problem defines the conversion.
4.2 Ecological pyramids answer different questions
An ecological pyramid is a diagram that arranges trophic levels. Its meaning depends on the quantity shown.
Pyramid of numbers: counts organisms at each level. It can be inverted when one large producer, such as a tree, supports many herbivorous insects. A parasite chain can also contain increasing numbers at successive levels.
Pyramid of biomass: compares standing mass of organisms, usually for a specified area and time. A terrestrial system often shows greater producer biomass than herbivore biomass, but an aquatic snapshot may show low producer standing mass alongside higher consumer biomass if producers reproduce quickly and are consumed rapidly. The measure is a snapshot; it does not mean producers fail to supply the food web over time.
Pyramid of energy or production: compares energy available or transferred per unit area over a defined time. It is generally upright because energy is lost from the usable pathway at each transfer. State the units and period. Do not draw an inverted energy pyramid simply because a biomass pyramid is inverted.
The exam method is simple: read the title, inspect the axis or unit, identify whether the diagram counts, weighs or measures energy over time, and only then decide whether the pyramid is upright. A figure without a measurement basis is incomplete.
4.3 Matter moves through pathways
Living organisms build and break down molecules. Elements move from air, water, rock, soil, sediment and organisms through biological and physical processes. The term *cycle* is a useful summary, but real elements can be stored for long periods in pools, exported to another region or transformed into a form that is temporarily unavailable to an organism.
Carbon: exchange among atmosphere, water and life
Plants, algae and some microorganisms take in carbon dioxide during photosynthesis and incorporate carbon into organic matter. Consumers obtain carbon by feeding. Respiration returns carbon dioxide to air or water. When organisms die, decomposition transfers carbon to soil, sediment, water and the atmosphere; the route and timing depend on conditions. Combustion of biomass or fossil fuels releases carbon dioxide and other products. Oceans also exchange carbon with the atmosphere, while carbonate formation and geological processes operate over longer timescales.
An exam diagram may simplify this into atmosphere → producer → consumer → decomposer → atmosphere, with additional storage pools in soils, water and sediments. Do not interpret the arrows as equal flows or infer that all carbon returns immediately. The size of a pool and the rate of transfer are different properties.
Nitrogen: fixation, transformations and return
Most organisms cannot use atmospheric nitrogen gas directly. Certain microorganisms convert nitrogen into biologically accessible forms through nitrogen fixation. Plants take up suitable nitrogen compounds from soil or water; consumers obtain nitrogen through food. Decomposition releases nitrogen from organic matter. Other microbial processes transform nitrogen compounds, including nitrification and denitrification; the exact pathway depends on oxygen, substrate and environmental conditions.
The useful exam distinction is between a process and a pool. Atmospheric N₂ is a large pool; fixation is a process that brings some nitrogen into biologically useful pathways. A simplified cycle should label its main transformations rather than suggest that a plant directly absorbs atmospheric N₂ through ordinary roots.
Water: movement, storage and return
Solar heating supports evaporation from land and water; plants release water vapour through transpiration. Condensation forms clouds, and precipitation returns water to land or ocean. Some water runs off into streams and rivers; some infiltrates soil and may recharge groundwater; some is stored temporarily in lakes, wetlands, snow or soil. Groundwater can later discharge to streams or coastal waters.
Water is not consumed in the same way as food energy, but usable freshwater is unevenly distributed across space and time. A catchment perspective links rainfall, soil, vegetation, slopes, drainage and human withdrawal. A wetland can slow or store water locally, but its role depends on its topography, soils, connection and water regime. Avoid absolute claims that every wetland prevents every flood or that every forest always increases river flow; the scale and conditions matter.
4.4 What can disrupt a cycle?
Human actions can accelerate, redirect or concentrate flows. Clearing vegetation can change runoff and erosion. Excess nutrient inputs can alter lake and coastal productivity. Drainage can reduce wetland storage and change soil conditions. Combustion adds carbon to the atmosphere faster than some natural processes can remove it. These examples are not all the same kind of change: some alter the size of a storage pool, some change a transfer rate, and some redirect material into a new pathway.
When a question asks about “the effect” of a disturbance, identify the pool and process involved. For example, fertilizer runoff can increase nutrient delivery to water. That input may stimulate algal growth where other conditions allow. If organic material then decomposes, oxygen demand may rise. Each arrow is a testable link; the input does not guarantee an identical result in every water body.
4.5 A data-reading exercise
Suppose an estuary monitoring table reports: dissolved nutrient concentration rises after heavy rain; algal abundance rises one week later; dissolved oxygen is lower at dawn than in late afternoon. The pattern is consistent with nutrient enrichment and daily oxygen variation, but several distinctions matter. A concentration is not the same as total nutrient load; high flow may dilute concentration while carrying more total material. Algae photosynthesize in daylight and respire continuously; decomposition also uses oxygen. A dawn value reflects processes through the night. The table suggests hypotheses but does not by itself establish the source of nutrients or prove a fish mortality event.
The strongest answer is one that describes what the data show, proposes a mechanism with appropriate caution, and identifies a needed measurement—such as flow, nutrient source, temperature or repeated oxygen readings. Environmental interpretation rewards precise limits, not overconfident stories.
Figure 4.1 — Three ecological pyramids: use the same producer/herbivore/predator labels in three panels. Show an upright energy pyramid, an example of an inverted numbers pyramid and an aquatic biomass snapshot. Include units and a note that shapes are schematic, not universal proportions.
Figure 4.2 — Three material pathways: separate carbon, nitrogen and water panels. Use different arrow styles for biological transformation, physical movement and storage. Label important pools and state “simplified; not to scale.”
Retrieval and exam traps
- Production is a rate; biomass is a standing quantity. Check time units.
- An energy pyramid differs from biomass and numbers pyramids.
- A cycle diagram is a simplified map of pools and transfers, not a sealed loop with equal flows.
- Plants take up available nitrogen compounds; ordinary roots do not directly absorb atmospheric N₂.
- Concentration and total load are not interchangeable.
- A measured time-of-day difference can arise from daily processes; compare like times and sampling methods.
Explain why a fast-growing algae population can have a small standing biomass on a survey date. Then choose one carbon-cycle pool and one transfer that can change on a short timescale. Finally, describe why rainfall concentration alone cannot tell you how much nutrient entered a lake.
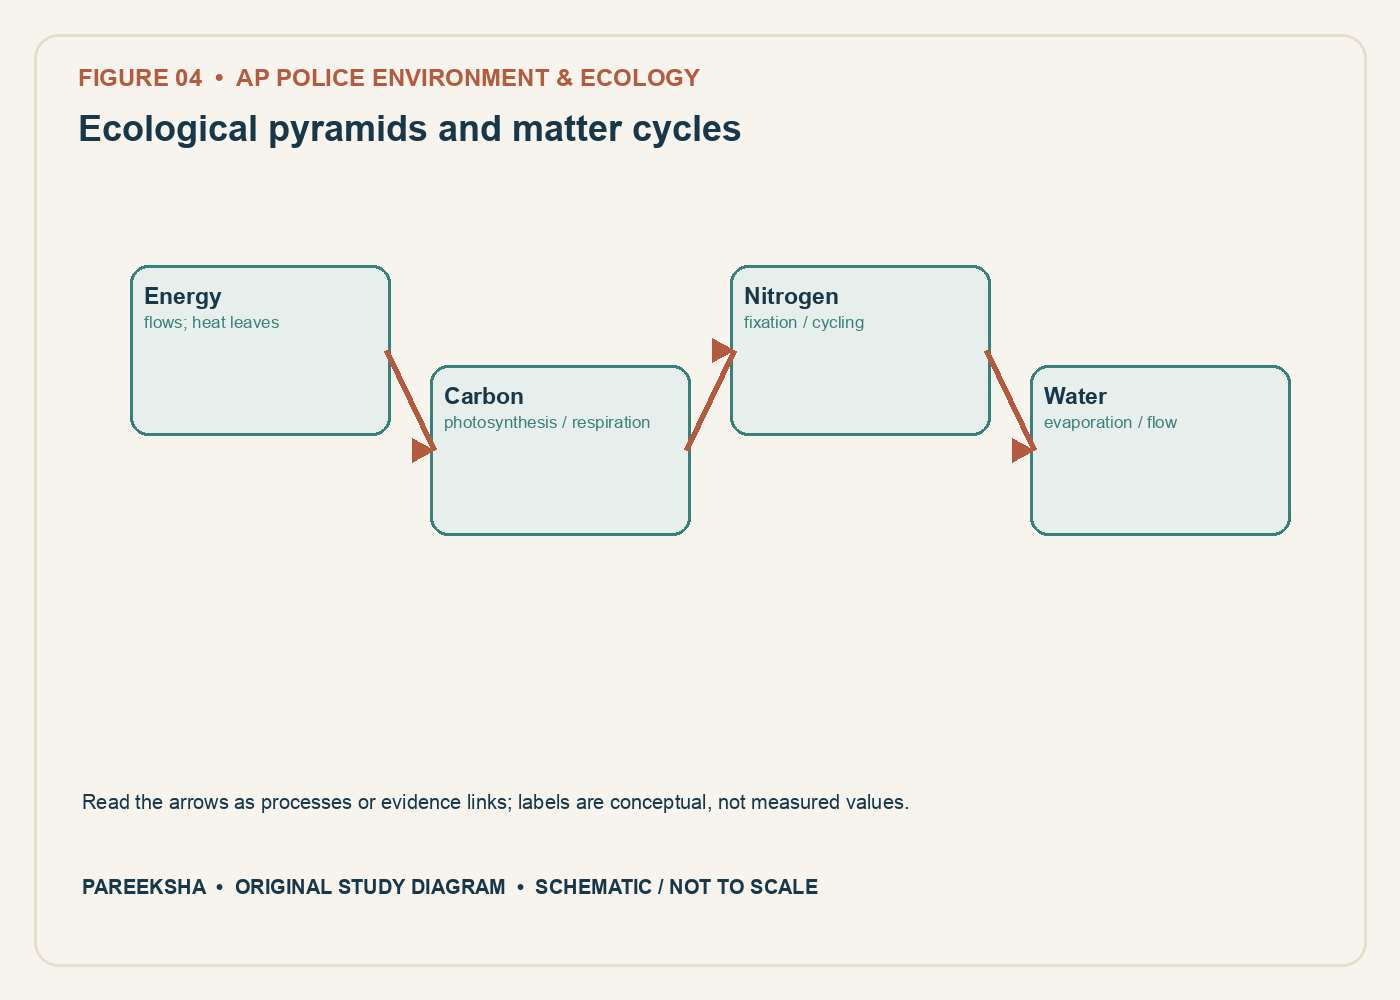
Figure 4.1 Ecological pyramids and matter cycles. Original explanatory diagram; schematic and not to scale.
Chapter practice questions
1. Net primary productivity is best described as:
A. Gross primary production minus producers’ respiration
B. Total rainfall minus evaporation
C. Consumer biomass divided by species richness
D. Energy released by decomposers only
Answer: A. Net primary productivity (NPP) is the energy or biomass accumulated by producers after subtracting their own respiration from gross primary production. It represents production available for growth and transfer to other trophic levels.
2. Which statement about standing biomass is correct?
A. It is the annual energy entering a biome
B. It is the amount of living material present at a specified time
C. It is the rate of nutrient movement through soil
D. It is always greatest at the top trophic level
Answer: B. Standing biomass is a stock measured at a point or over a defined interval. Productivity is a rate; confusing the stock with the rate can produce misleading comparisons.
3. A forest has high biomass but moderate annual productivity. This is possible because:
A. Biomass and productivity are identical measures
B. A large standing stock cannot persist
C. Biomass is a stock, while productivity is a rate of new production
D. Productivity measures only animal numbers
Answer: C. A system can contain a large accumulated stock while adding new biomass at a different rate. The measures have different units and time dimensions.
4. Which ecological pyramid is generally upright in both terrestrial and aquatic systems when measured as energy per area per time?
A. Pyramid of numbers
B. Pyramid of standing biomass
C. None; all are always inverted
D. Pyramid of energy
Answer: D. Available energy decreases at successive trophic transfers, so an energy pyramid is generally upright. Number and biomass pyramids can be inverted in some systems.
5. An inverted pyramid of biomass can occur in some aquatic systems because:
A. Small, rapidly turning-over producers may support a larger consumer biomass at a snapshot
B. Producers are absent from water
C. Consumers make energy from nothing
D. Water prevents photosynthesis
Answer: A. Phytoplankton can have low standing biomass but high turnover, supporting consumers. A snapshot of stock need not show the same pattern as the flow of production over time.
6. Which statement about a pyramid of numbers is most accurate?
A. It measures the mass of carbon in soil
B. It counts individuals at trophic levels and can take different shapes
C. It must always be upright
D. It measures energy transfer efficiency directly
Answer: B. A numbers pyramid counts organisms and can be inverted, such as when a few trees support many insects. It does not directly measure energy or biomass.
7. During photosynthesis, carbon dioxide is converted into organic carbon primarily by:
A. Top predators
B. Rocks alone
C. Producers
D. Consumers during respiration
Answer: C. Plants, algae and some bacteria fix inorganic carbon into organic molecules. Consumers obtain organic carbon through food.
8. Which process releases carbon dioxide from organisms back to the atmosphere or water?
A. Nitrogen fixation
B. Sedimentation only
C. Denitrification
D. Respiration
Answer: D. Cellular respiration oxidises organic molecules and releases carbon dioxide. Decomposition and combustion can also return carbon, but the question asks for a process occurring in organisms.
9. Nitrogen fixation converts atmospheric nitrogen gas into forms that can enter biological pathways. It is carried out mainly by:
A. Certain microorganisms
B. All mammals
C. Wind erosion alone
D. Every green plant independently
Answer: A. Nitrogen-fixing bacteria and archaea convert N₂ into biologically usable nitrogen compounds. Some live freely; others form associations with plants.
10. Which process returns nitrate in soil or water to nitrogen gas under suitable conditions?
A. Photosynthesis by trees
B. Denitrification by microbes
C. Evaporation
D. Predation
Answer: B. Denitrifying microorganisms reduce nitrate to gaseous nitrogen forms, returning nitrogen to the atmosphere. It often occurs under low-oxygen conditions, though details depend on microbes and substrate.
11. Water vapour released from plant leaves is a part of:
A. Nitrogen fixation
B. Biomagnification
C. Transpiration
D. Primary succession
Answer: C. Transpiration is water loss from plants, chiefly through stomata. Together with evaporation, it contributes to evapotranspiration.
12. A nutrient cycle differs from energy flow because nutrients:
A. Disappear completely at each trophic transfer
B. Enter ecosystems only through predators
C. Cannot move through water or soil
D. Move among living and non-living pools and can be reused
Answer: D. Elements such as carbon, nitrogen and phosphorus cycle among organisms and abiotic reservoirs. Energy flows through the system and is progressively dissipated as heat.
13. A rise in available nitrogen can increase plant growth in a nitrogen-limited system, but the response may be limited by:
A. Other factors such as phosphorus, water, light or temperature
B. The fact that plants do not need nutrients
C. The absence of any ecological interactions
D. Nitrogen’s status as an organism
Answer: A. Growth is often co-limited by multiple resources and conditions. Adding one nutrient does not guarantee unlimited production.
14. Which description of gross primary production is correct?
A. Biomass left after all consumers have eaten
B. Total carbon fixed by producers through photosynthesis before subtracting their respiration
C. The amount of nitrogen returned to soil
D. Energy lost as heat by top predators only
Answer: B. Gross primary production (GPP) is the total rate at which producers capture energy and fix carbon. NPP equals GPP minus producer respiration.
15. Why should a productivity figure state its area and time units?
A. Units are decorative and can be omitted
B. Area is relevant only to population counts
C. Productivity is a rate and comparisons require a consistent denominator and period
D. Time units turn biomass into a species name
Answer: C. Productivity is measured per unit area and time, so both are needed to compare systems. Different units can lead to false conclusions.
16. Phosphorus commonly enters aquatic systems through weathering and runoff. Compared with carbon and nitrogen, the phosphorus cycle is notable because it:
A. Depends only on animal respiration
B. Occurs only in the atmosphere
C. Cannot be affected by human activity
D. Has no major gaseous atmospheric phase in its usual description
Answer: D. The phosphorus cycle is commonly described as sedimentary, with weathering, uptake, food-web transfer and sedimentation; it lacks a major gaseous phase comparable to carbon or nitrogen.
17. Eutrophication can follow excessive nutrient inputs because these inputs may:
A. Stimulate high algal or plant production and later contribute to oxygen depletion
B. Remove all decomposers from water
C. Stop photosynthesis permanently
D. Convert oxygen into a mineral nutrient
Answer: A. Nutrient enrichment can increase production; decomposition of excess organic material can raise oxygen demand and cause low dissolved oxygen under suitable conditions. The sequence is context-dependent.
18. Which is a correct example of a carbon reservoir?
A. Only a predator’s stomach
B. Ocean water containing dissolved inorganic carbon
C. Sunlight alone
D. A trophic level with no carbon atoms
Answer: B. Oceans store large quantities of dissolved carbon. Other reservoirs include atmosphere, soils, vegetation, fossil fuels and carbonate rocks.
19. If a producer has a GPP of 1,200 energy units and uses 450 units in respiration, its NPP is:
A. 450 units
B. 1,200 units
C. 750 units
D. 1,650 units
Answer: C. NPP = GPP − producer respiration = 1,200 − 450 = 750 energy units. The units and time interval remain the same as those used for GPP.
20. A river’s nitrate concentration is high after heavy rain. Which interpretation is most careful?
A. It proves that one farm caused all nitrate in the basin
B. Rainfall contains no connection to nutrient transport
C. It proves denitrification has stopped everywhere
D. Runoff may have transported nitrogen, but source and cause require additional evidence
Answer: D. Runoff can move nutrients from land to water, but identifying a source requires spatial, temporal and possibly isotopic or land-use evidence. High concentration alone does not identify the responsible source.