Chapter 7 — Biodiversity, endemism and biogeography
Exam link: common foundation.
Learning aim: distinguish levels of biodiversity, interpret endemism and species richness, understand major threats, and use biogeographic regions without confusing them with administrative borders.
7.1 What biodiversity includes
Biodiversity is variation among living organisms and the ecological systems of which they are part. It is commonly considered at three linked levels:
- Genetic diversity: variation within a species or population. It can influence adaptation, disease response and the persistence of small populations.
- Species diversity: the variety of species and their relative representation in a community. Richness counts species; evenness describes how balanced their abundances are.
- Ecosystem diversity: the variety of habitats, ecological communities and processes across a landscape or region.
The levels interact. Genetic variation can support population persistence; species interactions shape ecosystem processes; habitats maintain the conditions needed for species. But one number cannot summarize every aspect. Two sites may contain the same number of species yet differ in which species are present, their abundance and their ecological roles.
7.2 Richness, evenness and the limits of a species count
Species richness is the number of different species recorded in a defined area and survey. It is not the same as total abundance. Evenness describes how individuals are distributed among species. A place with 20 species dominated by one species differs from a place where those species occur at more similar abundances.
Observed richness depends on sampling method, area, season, observer skill and detectability. A short survey may miss nocturnal, rare or seasonal species. Comparisons require similar effort and a documented method. “The site has no frogs” is too strong if the survey was conducted once at midday during a dry period.
Species richness is useful, but conservation priorities may also consider threat status, endemism, ecological function, cultural importance, irreplaceability and feasibility. A species-poor habitat can still support a rare endemic or a crucial process. A species-rich site can be degraded in other ways. Interpret the indicator that is actually measured.
7.3 Endemic, native, migratory and threatened
An endemic species is native to and restricted to a particular geographic area. The scale must be stated: a species may be endemic to a hill range, island, country or larger region. Endemism describes range, not necessarily rarity or threat status. A widespread species can be threatened for other reasons; an endemic species may be locally abundant but vulnerable because its entire range is small.
A native species occurs naturally in an area. A migratory species moves between places as part of a regular seasonal or life-cycle pattern; its conservation may require connected habitats across administrative borders. A threatened category refers to an assessed risk under a specified system and date. Different lists or versions may have distinct criteria. Do not infer a formal threatened status from a species' rarity in a local observation.
7.4 Biogeographic regions and ecological gradients
Biogeography examines the distribution of organisms and the historical and ecological factors that shape it. India contains major contrasts in climate, relief, rainfall, soils, isolation and evolutionary history. Biogeographic classification groups regions with broad ecological similarities. Such regions help compare patterns; their boundaries are generalized and need not match states, districts or forest divisions.
The Western and Eastern Ghats are distinct mountain systems with different rainfall patterns, elevations, continuity and ecological histories. The Eastern Ghats are discontinuous ranges separated by river valleys and plains, while the Western Ghats form a longer escarpment along the western side of the peninsula. These broad distinctions help explain habitat variation, but they do not establish a particular species' presence. Species-level claims require a reliable survey or official assessment.
Andhra Pradesh includes coastal, wetland, dryland and upland settings that connect to larger ecological regions. The same district can contain multiple habitat types; conversely, one landscape can cross several districts. A state outline is an administrative frame, not an ecological boundary.
7.5 Biodiversity hotspots: useful concept, limited meaning
A biodiversity hotspot is a conservation-priority concept based on high concentrations of endemic plants and substantial habitat loss, using criteria defined by the relevant framework. It is not a synonym for every place with many species. The Indian portion of a recognized hotspot designation should be described using its formal geographic definition and the source edition used.
Hotspot maps are generalized planning tools. They do not mean that every hectare inside the boundary has equal richness, nor that places outside it lack important biodiversity. Local endemism, threatened species and ecosystem services can make areas important even if they do not fall within a global hotspot polygon.
7.6 Threat pathways
Biodiversity loss often results from several pressures acting together. Common pathways include:
1. Habitat conversion and degradation: natural areas are cleared, drained, fragmented or altered in quality.
2. Overexploitation: harvesting exceeds the ability of populations to recover.
3. Invasive alien species: introduced organisms spread and cause ecological, economic or health impacts.
4. Pollution: contaminants or excess nutrients alter survival, reproduction and ecosystem processes.
5. Climate change: temperature, rainfall, ocean conditions and extreme events shift, affecting species and habitats.
These pressures interact. A small population in isolated fragments may be more vulnerable to disease or a weather shock. Pollution can compound habitat stress. Climate change can make a corridor or elevational route more important. A multiple-pressure analysis is stronger than a single-cause explanation when evidence points to several drivers.
7.7 Extinction risk, vulnerability and population evidence
Assessing risk requires more than counting individuals once. Relevant information can include population size and trend, range size, fragmentation, rate of decline, threats and life history. A short count may be influenced by migration or detectability. A range map may hide local absence or habitat degradation. Conservation assessments use defined methods and evidence; in an exam answer, name the indicator and its limit.
Small isolated populations can face reduced gene flow and increased risk from chance events. Corridors may help movement in some cases, but a corridor can also transmit disease or invasive species and may not help every organism. Design depends on species' movement, landscape barriers, safety and the purpose of connectivity.
7.8 Why biodiversity matters to people and ecosystems
Biodiversity supports ecological processes and can contribute to food, fibre, medicine, pollination, soil formation, water regulation, climate regulation, cultural identity and recreation. Benefits are often called ecosystem services, though the categories and valuation methods vary. The term is a framework for describing relationships between ecosystems and human well-being; it does not mean that every ecological value can be expressed fully in money.
Benefits and costs are distributed unevenly. A protected area can conserve habitat and species while restricting some local uses; a restored wetland can improve water functions while changing access. Effective policy recognizes rights, livelihoods, traditional knowledge and scientific evidence. Conservation should be evaluated not only by hectares or planted seedlings, but also by ecological outcomes and social processes.
7.9 AP examples: use names, not unsupported rankings
AP study examples can include the Eastern Ghats, coastal lagoons, mangrove systems, river corridors and dryland landscapes. Protected-area names and status may change through notification and administrative updates. A chapter can teach the ecological setting with a generalized locator and a dated list, but it should not present an old tourism page as a definitive current legal boundary. Before release, every named site must be checked against the relevant gazette notification or current Forest Department record and assigned a source date.
This caution is especially important for numerical claims: area, species counts, forest cover, Ramsar status and sanctuary boundaries can reflect different dates and definitions. The book will prefer qualitative ecological relationships unless a dated official figure materially improves exam preparation.
Figure 7.1 — Biodiversity levels: show genetic variation nested within populations, species within communities and ecosystems across a landscape; add a note that the nesting is a teaching relation, not a strict one-to-one boundary.
Figure 7.2 — Generalized AP ecology locator: place a simple Andhra Pradesh outline alongside coastal/wetland, river, Eastern Ghats and dryland habitat symbols. Do not draw protected-area boundaries from memory. Label only locations verified against the source register and mark the map “study locator; schematic; not an official boundary map.”
Exam traps and retrieval
- Richness counts species; evenness concerns relative abundance.
- Endemic means geographically restricted, not automatically rare or threatened.
- Native and endemic are not synonyms; migratory species may use multiple regions.
- An ecological region does not follow a district boundary.
- A hotspot is a defined conservation-priority framework, not a universal map of all biodiversity.
- A single count does not establish a long-term population trend.
- Benefits to people do not capture every ecological or cultural value.
Explain how two communities can have equal species richness but different evenness. Give one reason a survey may undercount a species. Finally, outline two interacting threats that could affect an isolated habitat patch and identify evidence needed to assess the trend.
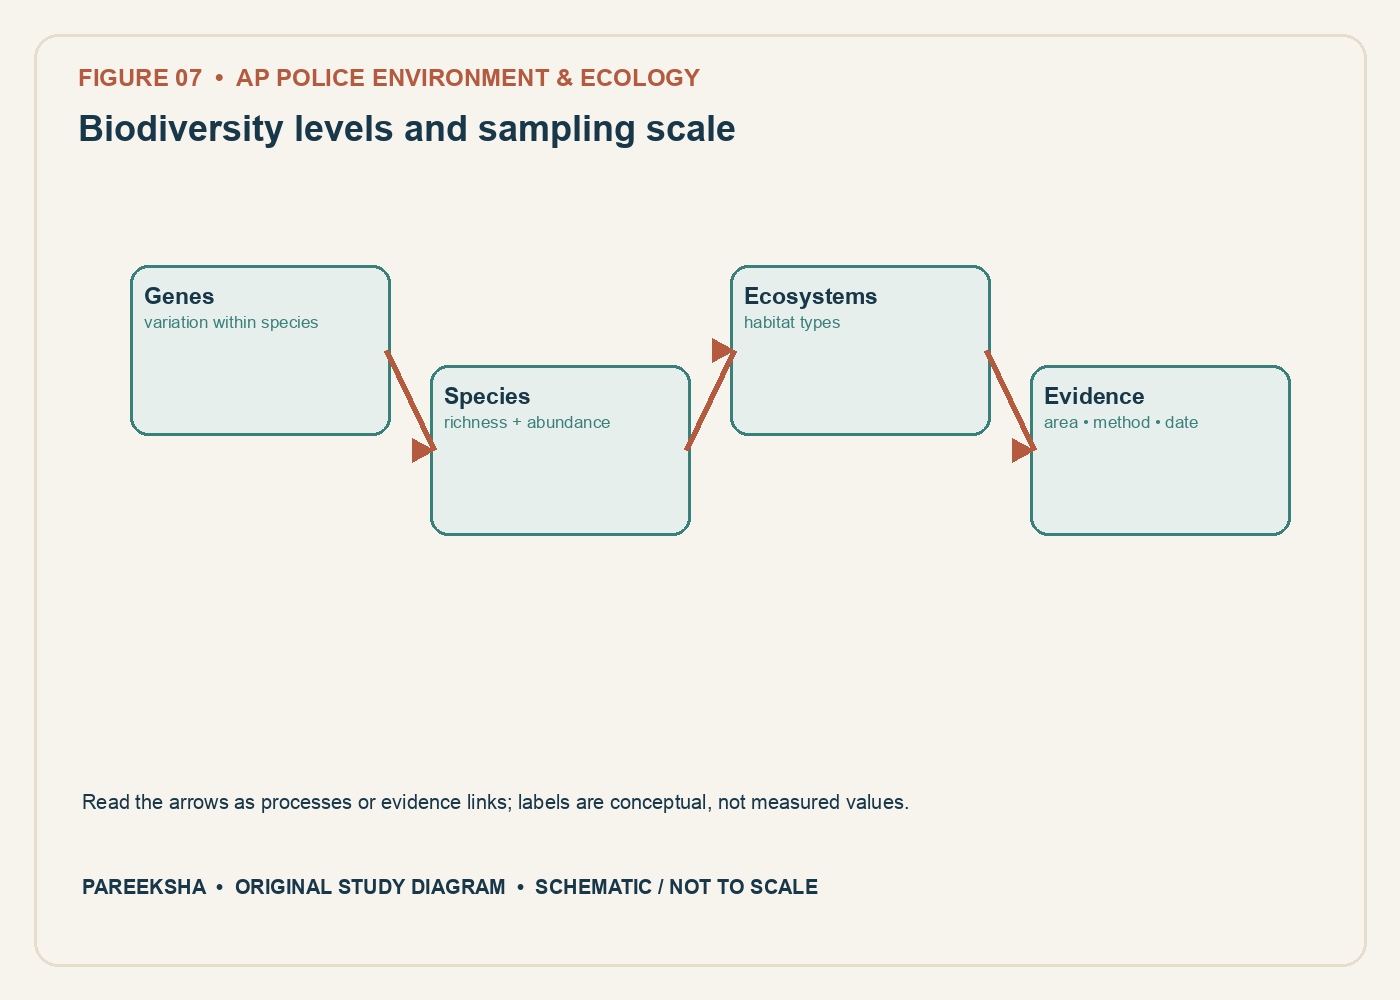
Figure 7.1 Biodiversity levels and sampling scale. Original explanatory diagram; schematic and not to scale.
Chapter practice questions
1. Genetic diversity refers to variation:
A. Within and among populations of the same species
B. Only between continents
C. Only among ecosystem types
D. In annual rainfall alone
Answer: A. Genetic diversity concerns genetic variation within a species, including differences among individuals and populations. It can influence adaptation and resilience.
2. Species richness is the:
A. Total genetic variation in one individual
B. Number of species recorded in a defined area or sample
C. Rate of carbon fixation
D. Number of habitats in an entire country by default
Answer: B. Richness counts species, but not their relative abundance. A richness comparison requires comparable sampling area, effort and detection methods.
3. Two sites each contain ten species, but one site is dominated by a single species. Which measure can help distinguish their diversity patterns?
A. Latitude alone
B. Total rainfall without ecological data
C. A measure incorporating both richness and relative abundance
D. Number of surveyors only
Answer: C. Diversity indices such as Shannon or Simpson incorporate abundance distribution as well as richness, though each has assumptions and interpretation limits.
4. Endemism means that a species:
A. Is found on every continent
B. Has been introduced by people everywhere
C. Is always abundant
D. Is naturally restricted to a particular geographic area
Answer: D. An endemic species has a naturally restricted distribution. Endemism is meaningful only with a stated geographic scale and reliable range evidence.
5. Why may an endemic species face elevated risk from habitat loss?
A. Its entire natural range may be small or concentrated in a limited region
B. Endemism guarantees rapid reproduction
C. It can always move to any climate
D. It cannot interact with people
Answer: A. A restricted range can mean that local habitat loss affects a large fraction of the global distribution. Risk still depends on population, ecology and threats.
6. Which statement correctly distinguishes alpha and beta diversity in common usage?
A. Alpha is genetic and beta is atmospheric
B. Alpha describes local diversity; beta describes compositional turnover among sites
C. Alpha counts rainfall and beta counts temperature
D. They are two names for population growth
Answer: B. Alpha diversity refers to diversity within a site or community; beta diversity describes differences or turnover among sites. Methods and definitions should be specified.
7. A biodiversity hotspot is identified using criteria that include:
A. The highest annual rainfall alone
B. The largest city population
C. High plant endemism and substantial habitat loss
D. Any site with a protected-area signboard
Answer: C. The widely used hotspot framework combines exceptional plant endemism with severe habitat loss. Exact threshold wording should be checked when a numeric question is asked.
8. Which is the strongest evidence that a species is locally absent rather than simply undetected?
A. One short survey by an unknown method
B. A map with no date
C. A lack of public photographs
D. Repeated, appropriately timed surveys using methods suited to detect it
Answer: D. Non-detection does not prove absence. Repeated surveys with suitable methods and effort improve confidence, though imperfect detection remains possible.
9. Which example best illustrates ecosystem diversity?
A. A landscape containing forest, river, grassland and wetland ecosystems
B. Different alleles in one population
C. The number of individuals of one species
D. Variation in body size within one herd only
Answer: A. Ecosystem diversity concerns variety among ecosystem types and ecological settings. Genetic and species diversity operate at different levels.
10. A seed bank contains many genetically distinct individuals of a native plant. Why can this matter for conservation?
A. It proves every seed will germinate
B. Genetic variation can support adaptive potential and restoration resilience
C. It eliminates the need to protect habitat
D. It guarantees resistance to all disease
Answer: B. Genetic variation may increase the capacity to respond to environmental change, but it does not guarantee survival or replace habitat protection.
11. Which action is an example of in-situ conservation?
A. Storing seeds in a freezer only
B. Keeping a specimen in a museum only
C. Protecting a species in its natural ecosystem
D. Maintaining a captive population with no habitat work
Answer: C. In-situ conservation protects species in their natural settings and maintains ecological relationships. Ex-situ methods can complement it.
12. A botanical garden maintains living collections outside the plants’ natural habitats. This is generally:
A. In-situ conservation only
B. A wildlife corridor
C. A biogeographic zone
D. Ex-situ conservation
Answer: D. Ex-situ conservation takes place outside the natural habitat, including botanical gardens, seed banks and captive breeding programmes.
13. Why is a species count from two surveys not automatically comparable?
A. Effort, timing, area, method and detectability may differ
B. Species counts never provide information
C. More observers always find fewer species
D. Surveys cannot be repeated
Answer: A. Sampling design influences the number detected. Standardised methods and effort are needed for defensible comparison.
14. A protected area contains a rare species but is isolated by roads and settlement. Which concern is most relevant?
A. Protection automatically removes every external pressure
B. Connectivity and movement between habitat patches may be limited
C. The species becomes non-native
D. Isolation increases genetic exchange by definition
Answer: B. Isolation may reduce movement and gene flow, depending on species and landscape permeability. Protected status does not eliminate pressures outside boundaries.
15. Which is a direct driver of biodiversity loss in many ecosystems?
A. The scientific naming of species
B. Measurement of species richness
C. Habitat conversion and fragmentation
D. Publication of a field guide
Answer: C. Habitat change is a major direct pressure, alongside overexploitation, invasive species, pollution and climate change. The relative importance varies by place.
16. Why may a species-level conservation assessment need both population trend and geographic range?
A. Range and trend are identical statistics
B. Population trend is irrelevant to conservation
C. Geographic range alone proves abundance
D. A species can have a broad range but still decline sharply, or a small range with local pressure
Answer: D. Range and trend provide different information. Neither alone fully describes population status or risk.
17. Which measure most directly represents evenness?
A. How similarly individuals are distributed among the species present
B. The number of habitats on a map
C. The area of a national park
D. The number of years of rainfall data
Answer: A. Evenness describes how equally abundance is distributed among species. It complements richness but does not replace it.
18. A survey records 40 species, but most individuals belong to one species. Which statement is correct?
A. Richness must be zero
B. Richness may be high while evenness is low
C. High dominance proves all species are invasive
D. Species abundance has no effect on diversity interpretation
Answer: B. Richness counts species; evenness describes relative abundance. A community can have many species but be strongly dominated by one.
19. Which statement about invasive alien species is most accurate?
A. Every non-native organism causes identical damage
B. Native species can never become invasive in disturbed habitats
C. Some introduced species spread and cause harm, but introduced status alone does not establish impact
D. Invasive species are always deliberately introduced
Answer: C. Origin, spread and impact are separate questions. Some introduced species become harmful invaders; others remain limited or have neutral effects.
20. Why should the phrase “biodiversity increased” be accompanied by a measure?
A. Biodiversity has only one universal measure
B. No ecosystem can be measured
C. It always means more individual animals
D. The statement could refer to genes, species, abundance, habitat types or an index
Answer: D. Biodiversity has multiple levels and metrics. A measured claim should specify the level, method, area and time period.
21. Which action best supports conservation decisions under uncertainty?
A. Monitor outcomes, disclose uncertainty and revise management when evidence changes
B. Assume the first estimate is exact forever
C. Avoid collecting baseline data
D. Replace all local observations with a national average
Answer: A. Adaptive management uses evidence and monitoring to update actions. It does not treat uncertainty as a reason to ignore risks.
22. A species is described as endemic to a mountain range. What must be checked before using that as an exam fact?
A. The colour of the map background
B. The range definition, taxonomic source, distribution evidence and reference date
C. The nearest city’s population only
D. Whether the species has a common name
Answer: B. Taxonomy and range records can change with new evidence. A precise, dated source prevents overbroad claims.