Statistics
What to remember
- Mean, median and mode locate the "centre" of data; range, mean deviation, variance and standard deviation measure how far the data spread around it.
- Variance is the mean of the squares minus the square of the mean: $\sigma^2 = \frac{\sum x_i^2}{n} - \bar{x}^2$. Standard deviation is its non-negative square root.
- Adding a constant to every observation shifts the mean and median but leaves every measure of spread unchanged. Multiplying by $a$ multiplies the mean by $a$, the standard deviation by $\vert a \vert$ and the variance by $a^2$.
- Combined variance of two groups is the weighted average of $\sigma_i^2 + d_i^2$, where $d_i$ is the distance of each group mean from the combined mean. Never average the variances alone unless the means are equal.
- To compare spread when means differ, use the coefficient of variation $\frac{\sigma}{\bar{x}} \times 100$. The smaller value means the more consistent data.
Why we need two kinds of numbers
Suppose two batters both average 40 runs over a season. One scores 38, 41, 40, 42, 39 in five matches, the other scores 0, 95, 5, 100, 0. The averages agree, yet nobody would call them equally reliable. A single central value hides this. So every data set gets two descriptions: where it sits (central tendency) and how widely it scatters (dispersion). This chapter builds both, first for raw lists (ungrouped data) and then for data given in class intervals (grouped data).
Measures of central tendency
Mean
For $n$ observations $x_1, x_2, \dots, x_n$ the arithmetic mean is
If the value $x_i$ occurs $f_i$ times and $N = \sum f_i$ is the total frequency, then
For grouped data, every observation in a class is taken to sit at the class mark (the midpoint of the class). This is an assumption, so the mean of grouped data is an estimate.
Big numbers are tiresome. Pick any convenient value $a$ (the assumed mean) and write $d_i = x_i - a$. Then
This works because $\sum f_i (x_i - a) = \sum f_i x_i - aN$. When all classes have the same width $h$, divide again: put $u_i = \frac{x_i - a}{h}$ and
The deviations from the true mean always add to zero: $\sum (x_i - \bar{x}) = 0$. Many questions are only this fact in disguise.
Median
Arrange the data in order. For odd $n$, the median is the $\frac{n+1}{2}$-th value. For even $n$, it is the average of the $\frac{n}{2}$-th and $\left(\frac{n}{2}+1\right)$-th values. Always sort first; picking the middle item of the list as given is the commonest slip.
For grouped data, build the cumulative frequency column. The median class is the first class whose cumulative frequency reaches $\frac{N}{2}$. Then
where $l$ is the lower limit of the median class, $C$ the cumulative frequency of the class just before it, $f$ its frequency and $h$ its width. The formula assumes the observations are spread evenly inside the class, so we move a fraction $\frac{N/2 - C}{f}$ of the way across.
Mode
The mode is the value that occurs most often. A data set can have no repeated value (no mode), one mode, or several.
For grouped data, the modal class is the class with the highest frequency. With $f_1$ its frequency, $f_0$ the frequency of the class before and $f_2$ of the class after,
The pull of the neighbours decides where inside the class the peak lies. If $f_0$ is larger than $f_2$, the mode slides towards the lower end.
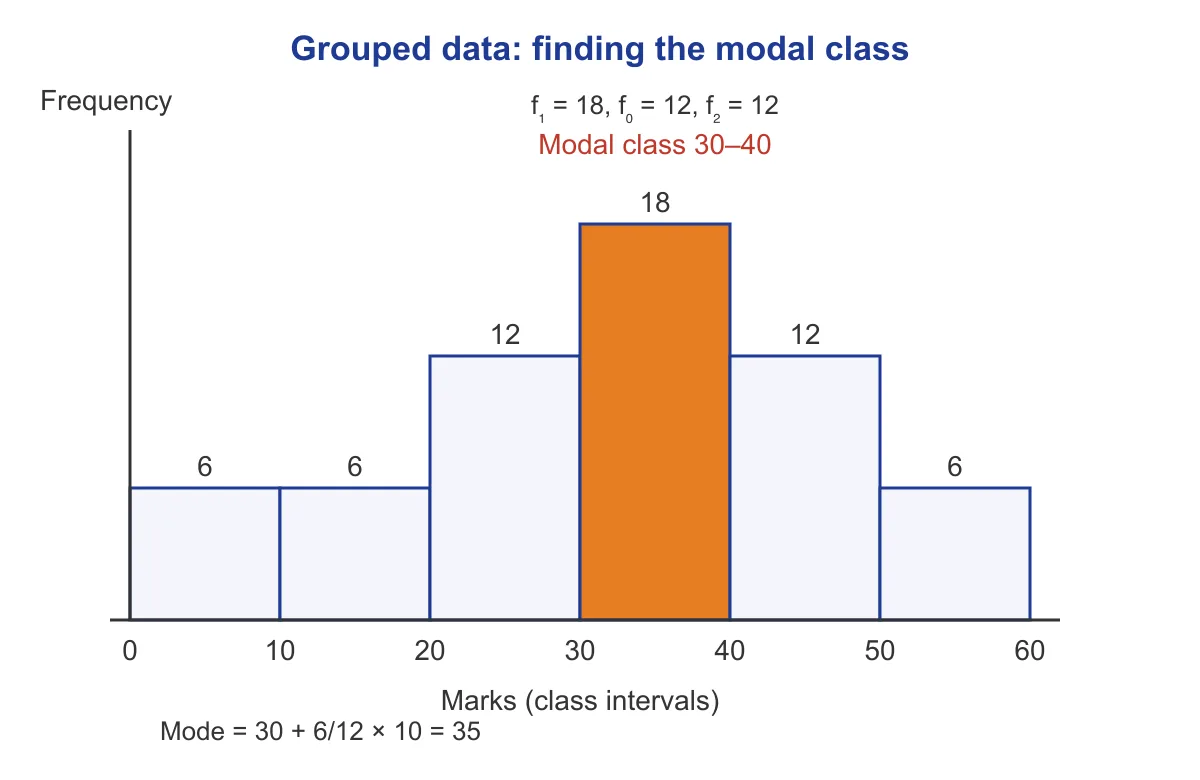
Figure 1.1: Modal class of a grouped distribution and the mode from the interpolation formula
For moderately skewed data the three measures are tied by the rough relation $\text{Mode} \approx 3\,\text{Median} - 2\,\text{Mean}$. It is an approximation, useful for estimating the third value when two are known.
Memory trick: "Mean is the mean one: it chases the extremes." A single huge value drags the mean; the median and mode hardly move. Use it to decide which measure a question wants when the data has an outlier.
| Measure | Uses every value? | Affected by an extreme value? | Always an actual observation? |
|---|---|---|---|
| Mean | Yes | Strongly | No |
| Median | No, only the order | Hardly | Only for odd $n$ |
| Mode | No, only the counts | No | Yes |
Example 1: Find the mean, median and mode of 14, 9, 7, 12, 9, 20, 9, 11, 17.
Sum $= 14+9+7+12+9+20+9+11+17 = 108$, and $n = 9$, so mean $= \frac{108}{9} = 12$.
Sorted: 7, 9, 9, 9, 11, 12, 14, 17, 20. The 5th value is 11, so median $= 11$.
The value 9 occurs three times and nothing else more than once, so mode $= 9$.
Check with the rough relation: $3(11) - 2(12) = 9$. It agrees.
Why this works: the sum is only needed for the mean, the sorting only for the median, and counting only for the mode. Do the three jobs separately.
Example 2: The marks of 60 students are grouped as follows. Find the mean, median and mode.
Classes $0$–$10$, $10$–$20$, $20$–$30$, $30$–$40$, $40$–$50$, $50$–$60$ have frequencies $6, 6, 12, 18, 12, 6$.
Class marks: 5, 15, 25, 35, 45, 55. Take $a = 35$, $h = 10$, so $u = -3, -2, -1, 0, 1, 2$.
$\sum f u = -18 - 12 - 12 + 0 + 12 + 12 = -18$. Mean $= 35 + 10 \times \frac{-18}{60} = 32$.
Cumulative frequencies: 6, 12, 24, 42, 54, 60. Since $\frac{N}{2} = 30$, the median class is $30$–$40$, with $C = 24$, $f = 18$:
$M = 30 + \frac{30 - 24}{18} \times 10 = 30 + 3.33 = 33.33$.
Modal class is also $30$–$40$: $f_1 = 18$, $f_0 = 12$, $f_2 = 12$, and $2f_1 - f_0 - f_2 = 12$. So mode $= 30 + \frac{6}{12} \times 10 = 35$.
Why this works: the median class is found from cumulative counts and the modal class from raw counts, and they need not be the same class, though here they are. Note the rough relation gives $3(33.33) - 2(32) = 36$, close to 35.
Measures of dispersion
Range
It uses only two observations, so one stray value changes it completely. It is quick, and no more than that.
Mean deviation
The mean deviation about a point $a$ (mean or median) is the average distance of observations from $a$:
For grouped data, $x_i$ is the class mark. The absolute value is essential: without it, the deviations about the mean cancel to zero and tell you nothing.
The sum $\sum \vert x_i - a \vert$ is smallest when $a$ is the median. So the mean deviation about the median never exceeds the mean deviation about the mean, and a mean deviation about any other point is at least as large. The quantity $\sum (x_i - a)^2$, in contrast, is smallest when $a$ is the mean.
Example 3: For 4, 7, 8, 13, 18 find the mean deviation about the mean and about the median.
Mean $= \frac{50}{5} = 10$. Distances: $6, 3, 2, 3, 8$, total $22$, so $\text{MD}(\bar{x}) = \frac{22}{5} = 4.4$.
Median $= 8$. Distances: $4, 1, 0, 5, 10$, total $20$, so $\text{MD}(M) = \frac{20}{5} = 4$.
Why this works: the median gave the smaller total, as it must. If your two answers come out the other way round, there is an arithmetic slip.
Variance and standard deviation
Variance is the mean of the squared deviations from the mean:
Expand the bracket and use $\sum x_i = n\bar{x}$:
This second form is the one to use in exams, because it needs only $\sum x_i$ and $\sum x_i^2$. For frequency data,
and, with class width $h$ and $u_i = \frac{x_i - a}{h}$,
The standard deviation is $\sigma = \sqrt{\sigma^2}$, taken positive. It carries the same unit as the data, while the variance carries the square of that unit. The variance is zero only when all observations are equal.
Squaring weights big deviations more heavily, so $\sigma$ is never smaller than the mean deviation about the mean. It follows that $\text{MD}(\bar{x}) \le \sigma$ always.
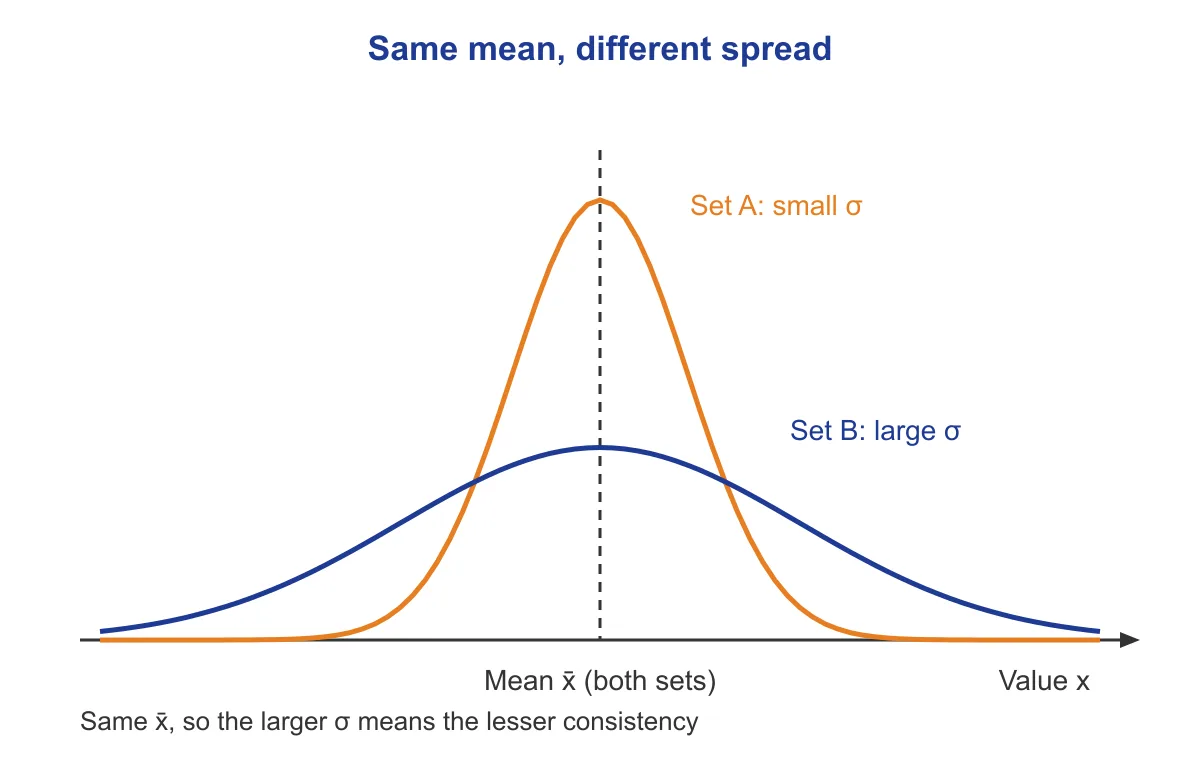
Figure 1.2: Two data sets with the same mean but different standard deviation
Two numbers worth remembering as results. The variance of the first $n$ natural numbers $1, 2, \dots, n$ is $\frac{n^2 - 1}{12}$. The variance of two numbers $a$ and $b$ is $\left(\frac{a - b}{2}\right)^2$, since both sit at distance $\frac{\vert a-b \vert}{2}$ from their mean.
Example 4: Find the variance and standard deviation of 4, 7, 8, 9, 12.
$\sum x = 40$, so $\bar{x} = 8$. $\sum x^2 = 16 + 49 + 64 + 81 + 144 = 354$.
$\sigma^2 = \frac{354}{5} - 8^2 = 70.8 - 64 = 6.8$, so $\sigma = \sqrt{6.8} \approx 2.6$.
Check by definition: deviations $-4, -1, 0, 1, 4$ have squares summing to $34$, and $\frac{34}{5} = 6.8$.
Why this works: both routes must agree, and the second one is a good self-check when marks are at stake.
Example 5: For Example 2, find the variance and standard deviation of the grouped data.
With $a = 35$, $h = 10$: $\sum f u = -18$. Squares $f u^2$: $6 \times 9, 6 \times 4, 12 \times 1, 0, 12, 24$, that is $54, 24, 12, 0, 12, 24$, total $126$.
$\sigma^2 = 100\left[\frac{126}{60} - \left(\frac{-18}{60}\right)^2\right] = 100\left[2.1 - 0.09\right] = 201$.
So $\sigma = \sqrt{201} \approx 14.2$.
Why this works: the factor $h^2$ undoes the scaling of $u$, and the shift $a$ costs nothing because variance ignores shifts.
Memory trick: "Mean of squares minus square of mean." Say it aloud, then say it again. Use it to rebuild the variance formula the moment your mind goes blank. The result can never be negative, so a negative answer means you subtracted the wrong way round.
Effect of shifting and scaling the data
Let $y_i = a x_i + b$ for every observation. Then:
| Quantity | New value |
|---|---|
| Mean, median, mode | $a \cdot(\text{old}) + b$ |
| Range, mean deviation, standard deviation | $\vert a \vert \cdot(\text{old})$ |
| Variance | $a^2 \cdot(\text{old})$ |
The reason is direct. The mean becomes $a\bar{x} + b$, so each deviation $y_i - \bar{y} = a(x_i - \bar{x})$. The shift $b$ has vanished, and the factor $a$ stays, giving $a^2$ inside the squared sum. A negative $a$ flips the order of the data but cannot make a spread negative, which is why $\vert a \vert$ appears.
This is the reason the step-deviation method works: coding $u = \frac{x - a}{h}$ is exactly such a transformation.
Example 6: The mean of $x$ is 12 and its variance is 16. Find the mean, variance and standard deviation of $y = 3 - 2x$.
Mean of $y$ $= 3 - 2(12) = -21$.
Variance of $y$ $= (-2)^2 \times 16 = 64$.
Standard deviation of $y = \sqrt{64} = 8$, which is also $\vert -2 \vert \times 4$.
Why this works: only the coefficient of $x$ enters the spread, so the $3$ and even the minus sign disappear.
Combined mean and variance of two groups
Group 1 has $n_1$ items, mean $\bar{x}_1$, variance $\sigma_1^2$. Group 2 has $n_2$, $\bar{x}_2$, $\sigma_2^2$. The combined mean is
Put $d_1 = \bar{x}_1 - \bar{x}$ and $d_2 = \bar{x}_2 - \bar{x}$. Within group 1, the sum of squared deviations from the combined mean is
because the cross term $2 d_1 \sum (x - \bar{x}_1)$ is zero. The same holds for group 2, so
The extra terms $d_1^2$ and $d_2^2$ measure how far apart the groups sit. When the two means coincide, $d_1 = d_2 = 0$ and the combined variance is just the weighted average of $\sigma_1^2$ and $\sigma_2^2$. Otherwise it is larger than that average.
Example 7: Group A has 20 items, mean 52, variance 25. Group B has 30 items, mean 62, variance 40. Find the combined mean and variance.
Combined mean $= \frac{20 \times 52 + 30 \times 62}{50} = \frac{1040 + 1860}{50} = 58$.
$d_1 = 52 - 58 = -6$ and $d_2 = 62 - 58 = 4$.
$\sigma^2 = \frac{20(25 + 36) + 30(40 + 16)}{50} = \frac{1220 + 1680}{50} = 58$.
Why this works: averaging only 25 and 40 would have given $34$, nowhere near. The gap between the group means contributes most of the answer.
Memory trick: "Own spread plus gap squared, then weigh by size." That is $\sigma_i^2 + d_i^2$ weighted by $n_i$. Use it to avoid forgetting the $d^2$ terms.
Another favourite is the data that was copied wrongly. Keep $\sum x$ and $\sum x^2$ and correct them, rather than recomputing from scratch.
Example 8: Ten observations have mean 50 and variance 25. One observation, 42, was read as 62. Find the correct mean and variance.
Recorded $\sum x = 500$ and $\sum x^2 = 10(25 + 2500) = 25250$.
Correct $\sum x = 500 - 62 + 42 = 480$, so the mean is $48$.
Correct $\sum x^2 = 25250 - 3844 + 1764 = 23170$.
Variance $= \frac{23170}{10} - 48^2 = 2317 - 2304 = 13$.
Why this works: variance is built entirely from the two sums, so fixing the sums fixes everything. Do not carry the old mean into the new variance.
Comparing two distributions
When two data sets have the same mean, the one with the smaller standard deviation is the more consistent. When the means differ, a bigger standard deviation may only reflect bigger numbers, so we scale by the mean. The coefficient of variation is
It has no unit, so data in rupees and data in kilograms can be compared. A smaller CV means more consistent (less variable) data. If the means are equal, comparing CVs is the same as comparing standard deviations.
Keep in mind how CV reacts to the transformations above. Scaling by $a > 0$ leaves it unchanged, since both $\sigma$ and $\bar{x}$ scale alike. Adding a constant changes the mean but not $\sigma$, so CV changes.
Example 9: Batter P averages 40 runs with standard deviation 12. Batter Q also averages 40, with standard deviation 18. Batter R averages 25 with standard deviation 6. Who is the most consistent?
$\text{CV}_P = \frac{12}{40} \times 100 = 30\%$, $\text{CV}_Q = \frac{18}{40} \times 100 = 45\%$, $\text{CV}_R = \frac{6}{25} \times 100 = 24\%$.
P is more consistent than Q (same mean, smaller $\sigma$). R has the smallest CV, so R is the most consistent of the three.
Why this works: R's raw standard deviation looks tiny, but only partly because R's scores are lower. The CV removes that effect.
Common traps
- Taking the middle item of an unsorted list as the median → sort first, then count.
- Using the class limit instead of the class mark in grouped mean, mean deviation or variance → use the midpoint of the class.
- Forgetting the cumulative frequency before the class in the median formula → the term is $\frac{N}{2} - C$, with $C$ from the class above the median class.
- Mixing up $f_0$ and $f_2$ in the mode formula → $f_0$ belongs to the class just before the modal class, $f_2$ to the one just after.
- Writing the variance as $\frac{\sum x^2}{n} - \frac{\sum x}{n}$ → the second term is the square of the mean.
- Adding or subtracting variances when data is shifted → a shift changes nothing in spread; only multiplication does.
- Scaling variance by $a$ instead of $a^2$, or giving a negative standard deviation for negative $a$ → the factor is $a^2$ for variance and $\vert a \vert$ for standard deviation.
- Averaging two variances to get the combined variance when the means differ → add the $d^2$ terms before weighting.
- Using CV when the mean is zero or negative, or comparing it for data where only a constant has been added → CV needs $\bar{x} > 0$ and is not a safe tool after a shift.
- Leaving out the absolute value in the mean deviation → deviations about the mean sum to zero, so take $\vert x_i - a \vert$.
Quick revision
- Mean $= \frac{\sum f x}{N}$; assumed mean form $\bar{x} = a + h\frac{\sum f u}{N}$.
- Median of $n$ sorted values: middle one if $n$ odd, average of the two middle ones if $n$ even.
- Grouped median $= l + \frac{N/2 - C}{f}\, h$.
- Grouped mode $= l + \frac{f_1 - f_0}{2f_1 - f_0 - f_2}\, h$.
- Rough relation for moderately skewed data: Mode $\approx 3\,$Median $- 2\,$Mean.
- Range $=$ maximum $-$ minimum.
- $\sum (x_i - \bar{x}) = 0$; $\sum \vert x_i - a \vert$ is least at the median; $\sum (x_i - a)^2$ is least at the mean.
- Mean deviation about the mean is never more than the standard deviation.
- $\sigma^2 = \frac{\sum x^2}{n} - \bar{x}^2 \ge 0$; $\sigma^2 = 0$ only if all values are equal.
- Variance of $1, 2, \dots, n$ is $\frac{n^2 - 1}{12}$; of two numbers $a, b$ it is $\frac{(a - b)^2}{4}$.
- For $y = ax + b$: mean $\to a\bar{x} + b$, standard deviation $\to \vert a \vert \sigma$, variance $\to a^2 \sigma^2$.
- Combined mean $= \frac{n_1 \bar{x}_1 + n_2 \bar{x}_2}{n_1 + n_2}$.
- Combined variance $= \frac{n_1(\sigma_1^2 + d_1^2) + n_2(\sigma_2^2 + d_2^2)}{n_1 + n_2}$, with $d_i = \bar{x}_i - \bar{x}$.
- $\text{CV} = \frac{\sigma}{\bar{x}} \times 100$; smaller CV means more consistent data.
Practice questions
What is the median of the observations 3, 11, 7, 5, 9, 15, 1?
- 5
- 11
- 9
- 7
Answer
D. 7
Sorted: 1, 3, 5, 7, 9, 11, 15. Seven values, so the 4th is the median, 7.
What is the mode of 4, 6, 6, 9, 4, 6, 9, 4, 6?
- 4
- 6
- 9
- 5
Answer
B. 6
Counts: 4 occurs 3 times, 6 occurs 4 times, 9 occurs 2 times. Mode is 6.
Seven observations are all equal to 7. What is their variance?
- 0
- 7
- 49
- 1
Answer
A. 0
Every deviation from the mean 7 is zero, so the variance is 0.
What is the range of the data 12, 5, 31, 18, 9?
- 31
- 17
- 26
- 36
Answer
C. 26
Range = 31 - 5 = 26.
The standard deviation of $x$ is $\sigma$. What is the standard deviation of $y = 4 - 3x$?
- $\sigma$
- $9\sigma$
- $3\sigma$
- $-3\sigma$
Answer
C. $3\sigma$
Shift 4 does not matter; scaling by $-3$ gives $\vert -3\vert \sigma = 3\sigma$. A standard deviation is never negative.
For the data 2, 5, 8, 12, 18, at which value of $a$ is $\sum \vert x_i - a \vert$ least?
- 12
- 9
- 10
- 8
Answer
D. 8
The sum of absolute deviations is least at the median. Sorted data has median 8 (the mean is 9, which is not the minimiser). Check: at 8 the sum is 6+3+0+4+10 = 23; at 9 it is 7+4+1+3+9 = 24.
What is the variance of the first $n$ even natural numbers $2, 4, \dots, 2n$?
- $\frac{n^2-1}{12}$
- $\frac{n^2-1}{3}$
- $\frac{n^2-1}{6}$
- $\frac{n^2+1}{3}$
Answer
B. $\frac{n^2-1}{3}$
The variance of $1,2,\dots,n$ is $\frac{n^2-1}{12}$. Doubling every value multiplies variance by 4, giving $\frac{n^2-1}{3}$. Check n=2: values 2,4 variance 1; formula gives 3/3 = 1.
For 16 observations, $\sum (x_i - 5) = -8$. What is their mean?
- $4.5$
- $4$
- $5.5$
- $-0.5$
Answer
A. $4.5$
$\sum x_i - 80 = -8$, so $\sum x_i = 72$ and the mean is $\frac{72}{16} = 4.5$.
In a grouped distribution, $u = \frac{x - 50}{5}$ and the mean of $u$ is $0.4$. What is the mean of $x$?
- $48$
- $50.4$
- $2$
- $52$
Answer
D. $52$
$\bar{x} = 50 + 5(0.4) = 52$.
Classes 10–20, 20–30, 30–40, 40–50, 50–60 have frequencies 5, 10, 14, 8, 3. What is the mode of the grouped data?
- 34
- 35
- 36
- 32
Answer
A. 34
Modal class 30–40, $f_1 = 14$, $f_0 = 10$, $f_2 = 8$. Mode $= 30 + \frac{4}{28-18} \times 10 = 34$.
The mean of 20 observations is 15. If one observation, 8, is replaced by 28, what is the new mean?
- 14
- 17
- 16
- 15.5
Answer
C. 16
Sum rises by 20, so the mean rises by $\frac{20}{20} = 1$ to 16.
What is the variance of the two numbers 7 and 17?
- 5
- 25
- 50
- 100
Answer
B. 25
Mean 12, each value is 5 away, so variance $= 25$. Formula $\left(\frac{17-7}{2}\right)^2 = 25$.
A data set of $n$ observations has variance $\sigma^2$. One observation, which equals the mean, is deleted. What is the new variance?
- $\frac{(n-1)\sigma^2}{n}$
- $\sigma^2$
- $\frac{(n+1)\sigma^2}{n}$
- $\frac{n\sigma^2}{n-1}$
Answer
D. $\frac{n\sigma^2}{n-1}$
The mean is unchanged and the deleted deviation is 0, so the sum of squared deviations stays $n\sigma^2$, now divided by $n-1$ items.
Every observation of a data set is increased by 5. Which of the following does NOT change?
- Coefficient of variation
- Median
- Mean deviation about the mean
- Mean
Answer
C. Mean deviation about the mean
Mean and median rise by 5. The deviations from the mean are unchanged, so the mean deviation is the same. CV = σ/mean changes because the mean changed.
What is the mean of 5, 8, 12, 15, 20?
- 10
- 12
- 13
- 14
Answer
B. 12
Sum = 60, n = 5, mean = 12.
What is the mean deviation about the mean of 3, 5, 7, 9, 11?
- 2.4
- 2
- 3
- 4.8
Answer
A. 2.4
Mean 7; distances 4, 2, 0, 2, 4 total 12; 12/5 = 2.4.
The mean of $x$ is 20. What is the mean of $y = 3x - 5$?
- 65
- 60
- 15
- 55
Answer
D. 55
Mean of $y$ = 3(20) - 5 = 55.
What is the variance of 2, 3, 5, 6, 9?
- 6
- 5
- 7
- 30
Answer
A. 6
Mean 5, squared deviations 9, 4, 0, 1, 16 sum to 30. Variance 30/5 = 6. Check: $\frac{4+9+25+36+81}{5} - 25 = 31 - 25 = 6$.
Classes 0–10, 10–20, 20–30, 30–40, 40–50 have frequencies 4, 6, 16, 9, 5. What is the median of the grouped data?
- 27.5
- 26.25
- 26.67
- 25
Answer
B. 26.25
$N = 40$, $N/2 = 20$. Cumulative: 4, 10, 26, so median class 20–30, $C = 10$, $f = 16$. Median $= 20 + \frac{10}{16} \times 10 = 26.25$.
40 students average 55 marks and another 60 students average 45 marks. What is the mean of all 100?
- 48
- 50
- 49
- 51
Answer
C. 49
$\frac{40 \times 55 + 60 \times 45}{100} = \frac{2200 + 2700}{100} = 49$.
What is the variance of the first 11 natural numbers?
- 11
- 10
- 12
- 10.5
Answer
B. 10
$\frac{n^2-1}{12} = \frac{120}{12} = 10$.
Five observations have mean 6 and variance 8. Three of them are 4, 6 and 10. What is the absolute difference between the other two?
- 6
- 4
- 8
- 2
Answer
A. 6
Sum of other two $= 30 - 20 = 10$. $\sum x^2 = 5(8 + 36) = 220$; known squares 16+36+100 = 152, so the two squares add to 68. Then $2ab = 100 - 68 = 32$, $(a-b)^2 = 68 - 32 = 36$, difference 6 (the numbers are 2 and 8).
Group A has 30 items, mean 50, variance 16. Group B has 20 items, mean 60, variance 36. What is the variance of the combined 50 items?
- 50
- 24
- 48
- 36
Answer
C. 48
Combined mean 54, $d_1 = -4$, $d_2 = 6$. $\sigma^2 = \frac{30(16+16) + 20(36+36)}{50} = \frac{960 + 1440}{50} = 48$.
Ten observations have mean 20 and variance 4. One of them, 25, was copied wrongly and should have been 15. What is the correct variance?
- 3
- 4
- 5
- 2.5
Answer
A. 3
$\sum x = 200$, $\sum x^2 = 10(4+400) = 4040$. Correct: $\sum x = 190$ (mean 19), $\sum x^2 = 4040 - 625 + 225 = 3640$. Variance $= 364 - 361 = 3$.
What is the mean deviation about the median of 6, 7, 10, 12, 13, 4, 8, 12?
- 2.75
- 2.5
- 3
- 2.25
Answer
A. 2.75
Sorted: 4, 6, 7, 8, 10, 12, 12, 13. Median $= \frac{8+10}{2} = 9$. Distances: 5, 3, 2, 1, 1, 3, 3, 4 total 22. $\frac{22}{8} = 2.75$.
The values 2, 4, 6, 8, 10 occur with frequencies 1, 2, 4, 2, 1. What is the variance?
- 6
- 2.4
- 5.2
- 4.8
Answer
D. 4.8
$N = 10$, mean = 6 (symmetric). Squared deviations weighted: $16 + 2(4) + 0 + 2(4) + 16 = 48$. Variance $= 4.8$. Check: $\frac{4 + 32 + 144 + 128 + 100}{10} - 36 = 40.8 - 36 = 4.8$.
Given below are two statements: Statement I: The mean deviation about the median is the least among the mean deviations about all points. Statement II: The sum of squares of deviations from a point is least when the point is the mean.
- Both Statement I and Statement II are correct
- Both Statement I and Statement II are incorrect
- Statement I is correct but Statement II is incorrect
- Statement I is incorrect but Statement II is correct
Answer
A. Both Statement I and Statement II are correct
Both are standard minimising properties: absolute deviations at the median, squared deviations at the mean.
Given below are two statements: Statement I: Adding 10 to every observation leaves the variance unchanged. Statement II: Multiplying every observation by 10 leaves the variance unchanged.
- Both Statement I and Statement II are correct
- Both Statement I and Statement II are incorrect
- Statement I is correct but Statement II is incorrect
- Statement I is incorrect but Statement II is correct
Answer
C. Statement I is correct but Statement II is incorrect
Shifting does not alter deviations, so I is correct. Multiplying by 10 multiplies the variance by 100, so II is incorrect.
Given below are two statements: Statement I: The standard deviation has the same unit as the observations. Statement II: The coefficient of variation has no unit.
- Both Statement I and Statement II are correct
- Both Statement I and Statement II are incorrect
- Statement I is correct but Statement II is incorrect
- Statement I is incorrect but Statement II is correct
Answer
A. Both Statement I and Statement II are correct
The square root of the squared-unit variance returns to the original unit. CV is a ratio of two quantities in the same unit, hence unitless.
Given below are two statements: Statement I: A data set always has exactly one mode. Statement II: For an even number of observations, the median is always one of the observations.
- Both Statement I and Statement II are correct
- Both Statement I and Statement II are incorrect
- Statement I is correct but Statement II is incorrect
- Statement I is incorrect but Statement II is correct
Answer
B. Both Statement I and Statement II are incorrect
2, 2, 5, 5 has two modes, so I is incorrect. For 1, 2, 3, 4 the median 2.5 is not an observation, so II is incorrect.
Given below are two statements: Statement I: The mean deviation about the mean can be larger than the standard deviation for some data. Statement II: The variance of any data set is non-negative.
- Both Statement I and Statement II are correct
- Both Statement I and Statement II are incorrect
- Statement I is correct but Statement II is incorrect
- Statement I is incorrect but Statement II is correct
Answer
D. Statement I is incorrect but Statement II is correct
The mean of $\vert d \vert$ never exceeds the square root of the mean of $d^2$, so I is incorrect. Variance is a mean of squares, so II is correct.
Assertion (A): Adding 5 to every observation leaves the standard deviation unchanged. Reason (R): Shifting every observation by the same amount keeps the distances between observations, and from the mean, unchanged.
- Both A and R are true and R is the correct explanation of A
- Both A and R are true but R is not the correct explanation of A
- A is true but R is false
- A is false but R is true
Answer
A. Both A and R are true and R is the correct explanation of A
Both true; the unchanged distances are exactly why the standard deviation is unchanged.
Assertion (A): The mean deviation about the mean of 3, 5, 7 is $\frac{4}{3}$. Reason (R): The sum of deviations of observations from their mean is zero.
- Both A and R are true and R is the correct explanation of A
- Both A and R are true but R is not the correct explanation of A
- A is true but R is false
- A is false but R is true
Answer
B. Both A and R are true but R is not the correct explanation of A
Distances 2, 0, 2 give $\frac{4}{3}$, so A is true. R is also true, but it says nothing that produces the value $\frac{4}{3}$; absolute values are used precisely because plain deviations cancel.
Assertion (A): If every observation is multiplied by $-2$, the variance is multiplied by $-2$. Reason (R): For $y = ax + b$, the variance of $y$ is $a^2$ times the variance of $x$.
- Both A and R are true and R is the correct explanation of A
- Both A and R are true but R is not the correct explanation of A
- A is true but R is false
- A is false but R is true
Answer
D. A is false but R is true
The variance gets multiplied by $(-2)^2 = 4$, so A is false. R is the correct rule.
Match List I with List II. List I: a. Mean of 2, 4, 6, 8 b. Median of 3, 9, 1, 8 c. Mode of 7, 2, 7, 4, 2, 7 d. Range of 4, 10, 7 List II: i. 5 ii. 5.5 iii. 6 iv. 7
- a-iii, b-ii, c-i, d-iv
- a-ii, b-i, c-iv, d-iii
- a-i, b-ii, c-iv, d-iii
- a-i, b-iii, c-iv, d-ii
Answer
C. a-i, b-ii, c-iv, d-iii
a: 20/4 = 5. b: sorted 1, 3, 8, 9, median (3+8)/2 = 5.5. c: 7 occurs three times. d: 10 - 4 = 6.
The mean of $x$ is 10 and its variance is 4. Match List I with List II. List I: a. Mean of $2x$ b. Variance of $x + 3$ c. Variance of $2x$ d. Mean of $x - 3$ List II: i. 4 ii. 7 iii. 16 iv. 20
- a-ii, b-i, c-iii, d-iv
- a-iv, b-i, c-ii, d-iii
- a-iv, b-i, c-iii, d-ii
- a-iv, b-iii, c-i, d-ii
Answer
C. a-iv, b-i, c-iii, d-ii
a: 20. b: shift leaves variance 4. c: $2^2 \times 4 = 16$. d: 10 - 3 = 7.
Match List I with List II. List I: a. Mean by step deviation b. Variance of ungrouped data c. Coefficient of variation d. Median of grouped data List II: i. $\frac{\sigma}{\bar{x}} \times 100$ ii. $l + \frac{N/2 - C}{f} h$ iii. $a + h\frac{\sum f u}{N}$ iv. $\frac{\sum x^2}{n} - \bar{x}^2$
- a-ii, b-iv, c-i, d-iii
- a-iii, b-i, c-iv, d-ii
- a-iv, b-iii, c-ii, d-i
- a-iii, b-iv, c-i, d-ii
Answer
D. a-iii, b-iv, c-i, d-ii
Direct recall of the four standard formulas.
The scores $x$ of 50 students have mean 36 and variance 25. Each score is changed to $y = \frac{3x + 12}{2}$. What is the coefficient of variation of $y$?
- $15\%$
- $12.5\%$
- $25\%$
- $8.33\%$
Answer
B. $12.5\%$
Mean of $y = \frac{3(36)+12}{2} = 60$. Standard deviation $= \frac{3}{2} \times 5 = 7.5$. CV $= \frac{7.5}{60} \times 100 = 12.5\%$.
Group P has 40 observations with mean 30 and standard deviation 6. Group Q has 60 observations with mean 20 and standard deviation 3. What is the variance of the 100 observations taken together?
- $48$
- $19.8$
- $24.5$
- $43.8$
Answer
D. $43.8$
Combined mean $\frac{1200+1200}{100} = 24$; $d_1 = 6$, $d_2 = -4$. $\sigma^2 = \frac{40(36+36) + 60(9+16)}{100} = \frac{2880+1500}{100} = 43.8$.
Five observations are in arithmetic progression and their mean deviation about the mean is 12. What is their variance?
- 100
- 144
- 200
- 250
Answer
C. 200
Terms $a-2d, a-d, a, a+d, a+2d$. Mean $a$; MD $= \frac{2d+d+0+d+2d}{5} = \frac{6d}{5} = 12$, so $d = 10$. Variance $= \frac{4d^2+d^2+0+d^2+4d^2}{5} = 2d^2 = 200$.