A spending graphic sorts many appropriations into accessible themes: welfare, education, health, rural development, water, energy and others. These labels help orientation but do not replace account heads. “Welfare” can include payments through several departments; “water resources” can include capital-intensive works; “interest and principal” combines two transactions with different budget treatment. The examiner may ask the broad theme, but an exact figure should be drawn from the official table or department demand.
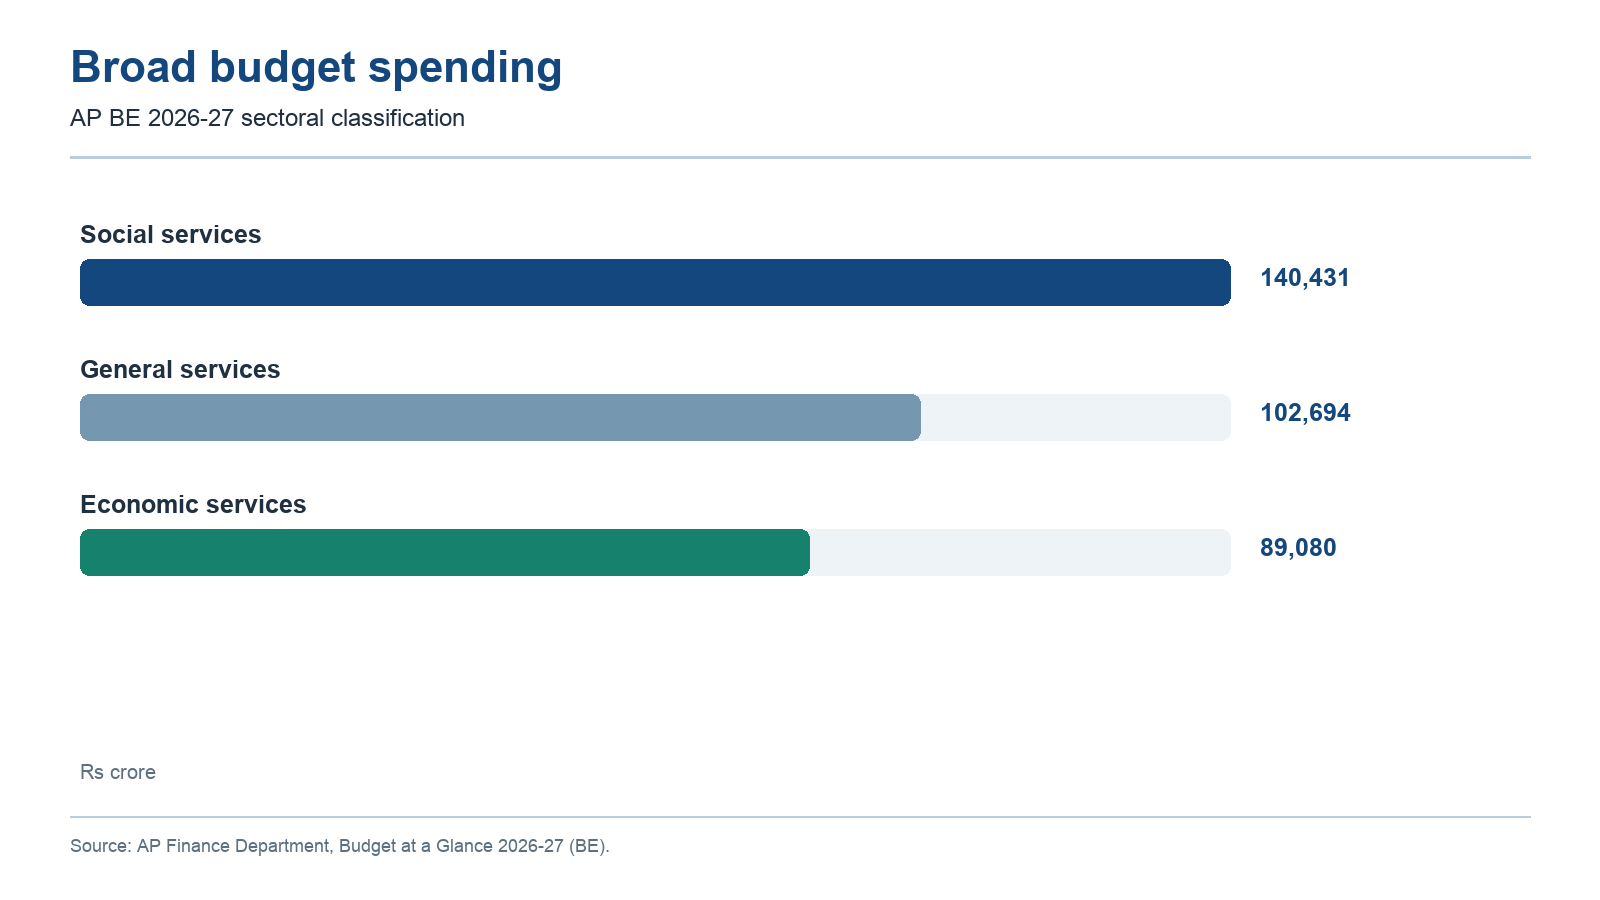
The BE 2026-27 sectoral table gives social services ₹1,40,431.05 crore, economic services ₹89,080.15 crore and general services ₹1,02,694.13 crore in its broad grouping. These figures add to ₹3,32,205.33 crore. In that classification, social services have the largest of the three shares. Within social services, general education, medical services, welfare, housing and urban development are separate entries, but they should not be added to a headline that already includes them.
This is a useful exercise in avoiding double counting. If a chart says “education” and the sector table lists “general education,” check whether technical education is elsewhere and whether the chart's definition is wider. A department budget can also include grants to local bodies or institutions. The safest exam habit is to reproduce the label as printed and note its source year.
Worked example: A social-services total includes categories such as education and health. If you add the education and health entries to social services again, you count them twice. Read the budget table as a hierarchy: total spending, broad service group, narrower line. The 2026–27 BE broad groups sum to the stated expenditure total. When a popular 'rupee goes to' graphic uses different labels, do not force its slices into the sector table without checking definitions.
Active recall: Which broad service group is largest in BE 2026-27? Why can summing two different budget graphics double count?
The three broad service groups, BE 2026-27
Sectoral groupings add to the ₹3,32,205.33 crore total; do not add them again to the total.
Read this visual
Social, economic and general services form one exhaustive broad classification in this chart. Their totals add to the overall expenditure estimate. A narrower education or irrigation allocation sits inside one group and must not be added to the full total again.
Map geometry: APSDMA. Budget figures and region descriptions: AP Finance Department. Educational comparison visual.