The 2024-25 Socio Economic Survey was compiled when AP had 26 districts, while the current official district boundary map has 28. A statistic for an old parent district cannot simply be relabelled as a new district's statistic. New districts may combine different mandals and economic activities. Population, per-capita income, area, literacy and crop shares need recomputation from appropriate lower-level data before they can be compared on the new map.
Regional inequality can arise from water reliability, terrain, industrial access, education, transport and historical investment. The north-coast hills, Godavari delta, Amaravati-centred urban belt, south coast and Rayalaseema interior have different starting conditions. A blanket statement that all coastal districts are wealthy or all interior districts are poor would be misleading. A good map exercise identifies a mechanism: for example, a port may reduce freight cost, while a remote mandal faces a longer trip to the same market.
For exam recall, date the district count and any ranking. The 2026-27 budget speech discusses the new Visakhapatnam and Amaravati economic regions using the current map. The 2024-25 survey's district indicators belong to its earlier geography. Use the map to see where a claim applies; use the source's year to judge whether its boundary definition is current.
Worked example: A survey published using 26 districts cannot be mapped onto today's 28 polygons by merely changing two labels. Markapuram and Polavaram changed the administrative aggregation. A reliable comparison would use village or mandal source data and rebuild both periods on one common boundary, or clearly retain each year's original geography. If the data are not available, describe the limitation instead of inventing a district growth ranking.
Active recall: Explain why a 26-district ranking cannot be copied directly into a 28-district table. Name two physical causes of regional economic difference.
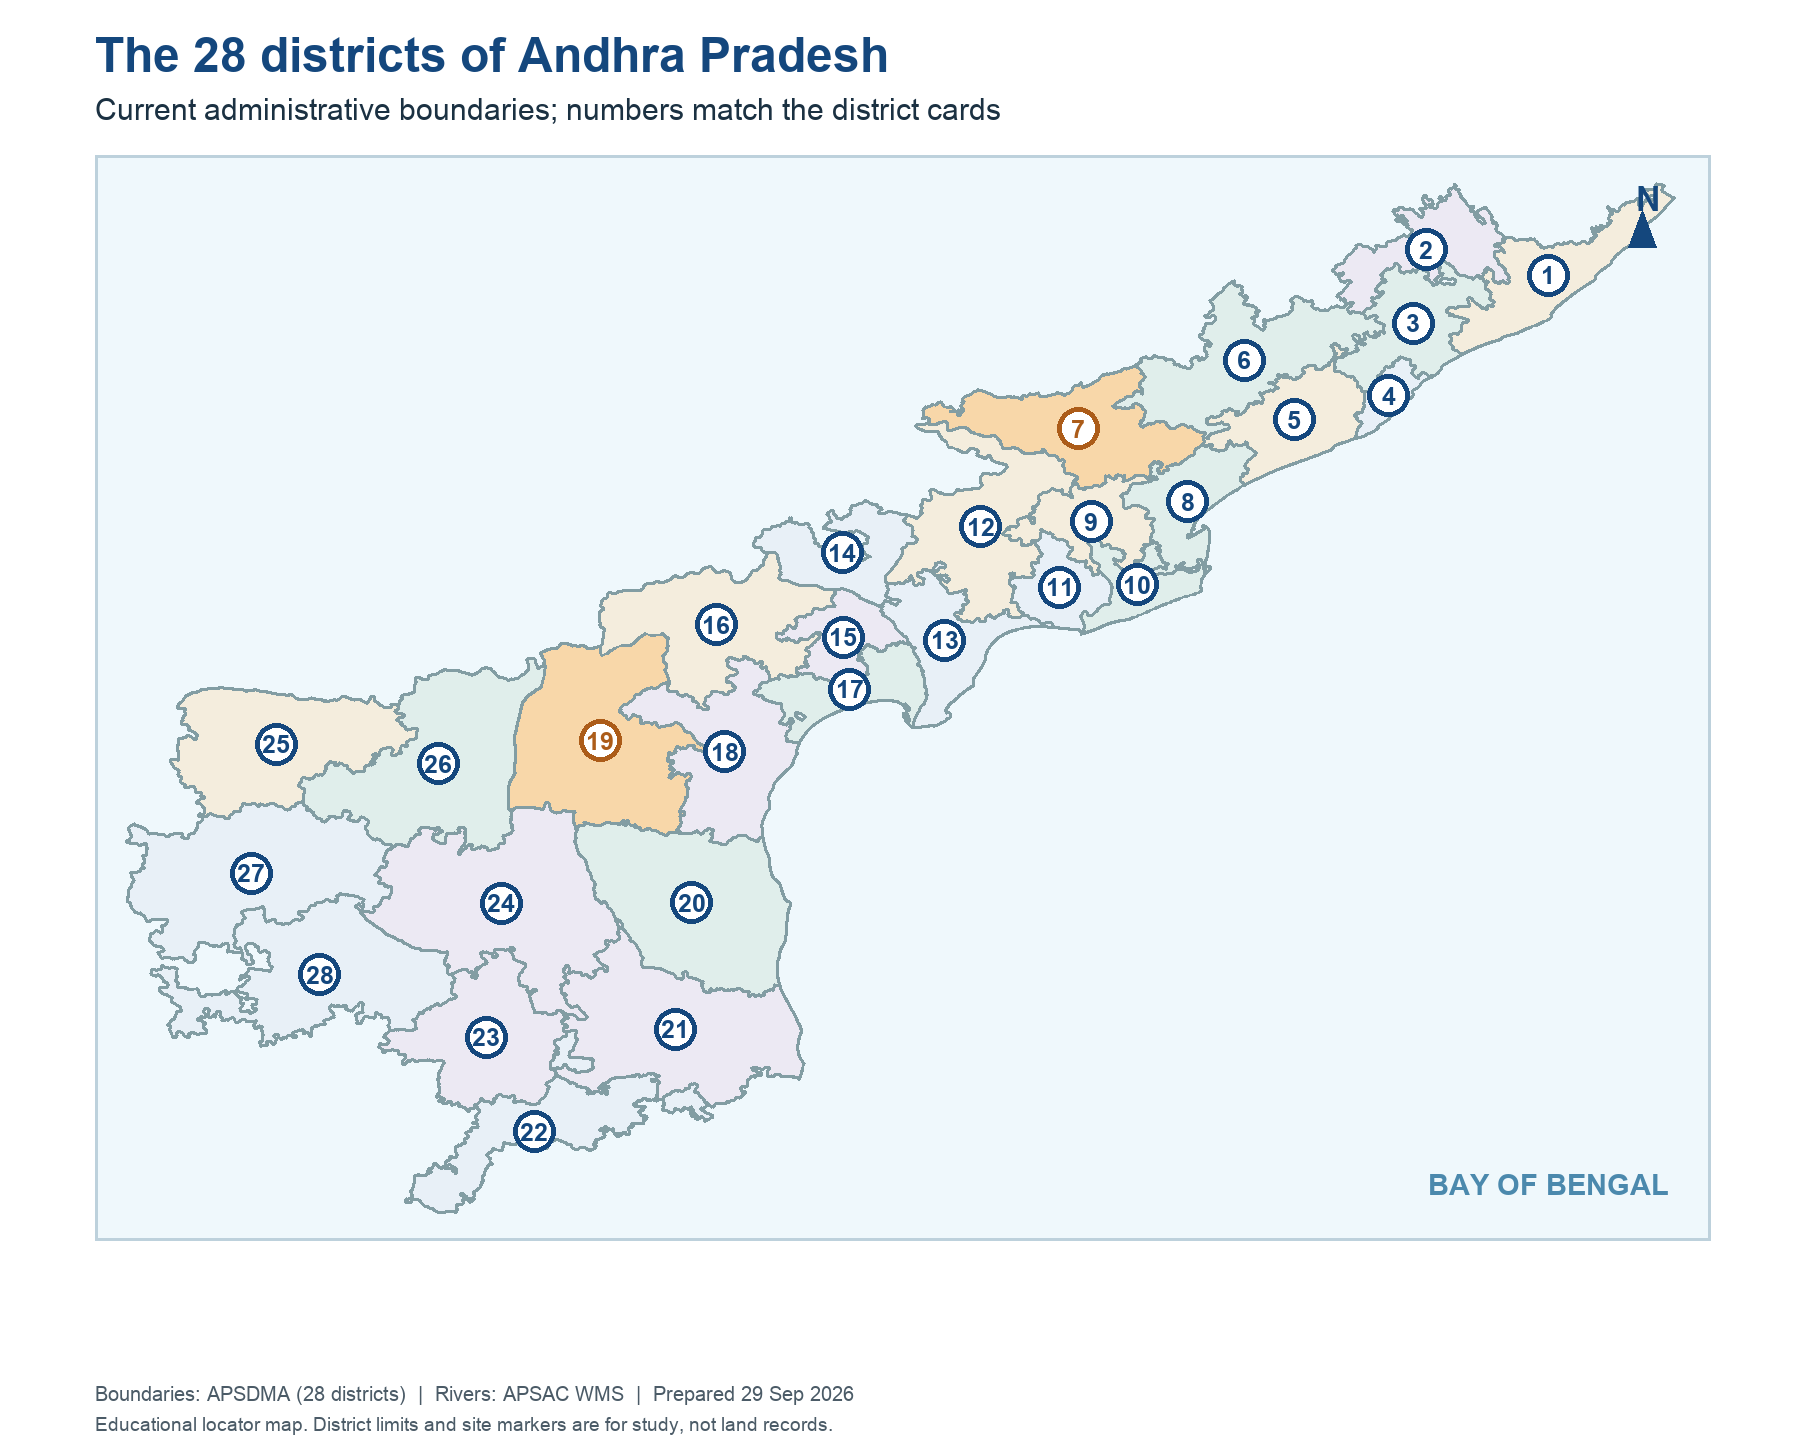
The 28-district map for economic data
District numbers correspond to the map key. A 2024-25 26-district survey statistic must not be directly relabelled onto this current boundary map.
Read this visual
The 28 numbered polygons depict the current administrative arrangement. A district statistic from the 2024–25 survey was produced for an older arrangement; it cannot be reassigned to these polygons by renaming rows. Use the key for location, then check the statistical source's date.
Map geometry: APSDMA. Budget figures and region descriptions: AP Finance Department. Educational comparison visual.
28 district map key
01 Srikakulam | 15 Guntur |
02 Parvathipuram Manyam | 16 Palnadu |
03 Vizianagaram | 17 Bapatla |
04 Visakhapatnam | 18 Prakasam |
05 Anakapalli | 19 Markapuram |
06 Alluri Sitharama Raju | 20 Sri Potti Sriramulu Nellore |
07 Polavaram | 21 Tirupati |
08 Kakinada | 22 Chittoor |
09 East Godavari | 23 Annamayya |
10 Dr B R Ambedkar Konaseema | 24 YSR Kadapa |
11 West Godavari | 25 Kurnool |
12 Eluru | 26 Nandyal |
13 Krishna | 27 Anantapuramu |
14 NTR | 28 Sri Sathya Sai |