Read the table before the question
Identify what each row and column represents, the unit and whether entries are counts, money, rates or percentages. A table may show years across columns and organisations down rows; swapping them produces a plausible but wrong number. If a total row appears, check whether it includes every category or only a subgroup. One cell can be read directly; a comparison, sum or ratio needs calculation.
Three common operations
For a row with 120, 150 and 180 units across three years, the total is 450 and the average is 150. The rise from 120 to 180 is 60 units, or 50% of the starting 120. The share of the final year in the three-year total is 180/450=40%. These are three different bases. To compare two groups, write their values side by side and label the operation before calculating. For a ratio, reduce both numbers by their greatest common divisor only after ensuring they have the same unit.
Missing cells and checking
If a row total is 600 and known entries sum to 440, the missing cell is 160. A grand total may give the same answer through a column check. Use that second path where available. A close option often corresponds to a wrong row, a skipped year or a percent calculated against the final value instead of the original value. In practice, place a finger or highlight on the exact row and column, then write the two numbers that matter. Do not copy the whole table into your working.
Read coordinates, not just numbers
Imagine a table with Unit A at 80 in Period 1 and 100 in Period 2; Unit B at 70 and 95. The Period 2 total is 100+95=195. Unit A's increase is 100−80=20, while Unit B's increase is 95−70=25. The total increase is 45. Reading the correct number from the wrong period could still produce a plausible option, so say the row and column aloud: “Unit B, Period 2, 95.” A table cell is an intersection, not a free-standing quantity.
For the same table, Unit A's percentage increase is 20/80=25%; Unit B's is 25/70≈35.7%. Unit B's new value is lower than Unit A's, yet its percentage growth is higher. This is why a ranking by final value may differ from a ranking by growth. If a question asks which group improved most, check whether it means absolute improvement or percentage improvement. Without that distinction, a calculation may be correct but answer the wrong question.
Row totals and column totals
If a table includes a total row and total column, compute a missing cell through the shortest route. A row total of 340 with entries 120, 90 and a blank gives 130. If the corresponding column total also leads to 130, the two independent sums reinforce the reading. However, do not double-count totals: a grand total already includes the component rows. When calculating an average, divide by the number of component entries, not by the number of rows including the total row.
A compact working layout
Write “requested cells → operation → unit” on scratch paper. For example: “A/P2 100; B/P2 95 → 100+95=195 units.” For a share, add the denominator: “A/P2 100; P2 total 195 → 100/195.” Round only after forming the correct fraction. This short route is faster than copying the entire table and easier to audit when an option seems wrong. The chart questions in this chapter use deliberately synthetic values; focus on the reading procedure, not on memorising any displayed number.
Practice — 50 questions
Attempt every item before reading the answers. Use the chart or caselet printed with the question.
1. What is the combined Period 1 value for Unit A and Unit B?
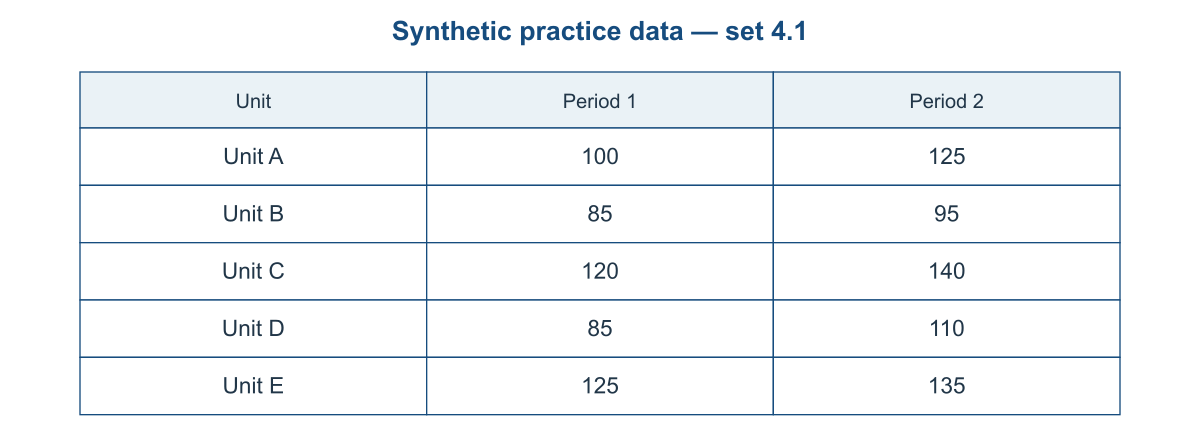
A. 190 B. 195 C. 185 D. 180
2. By how many units did Unit A change from Period 1 to Period 2?
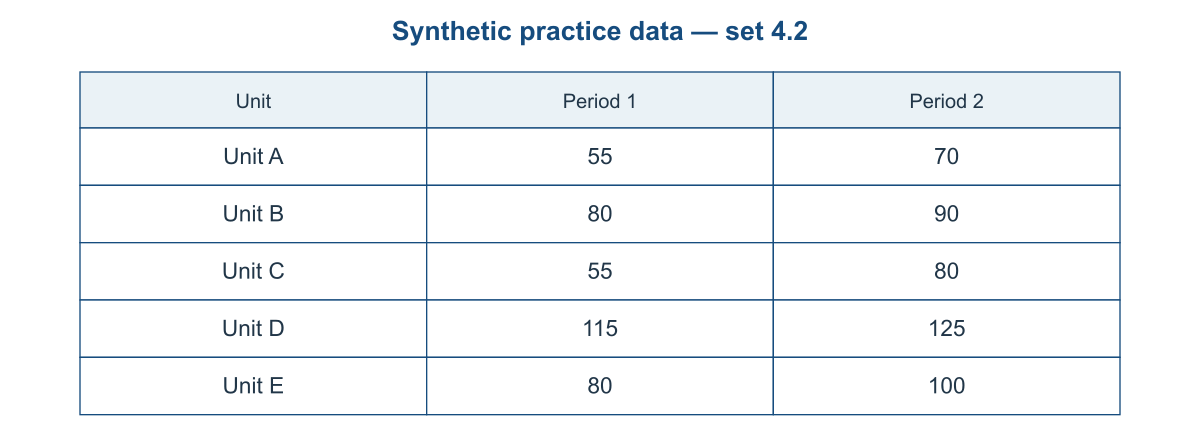
A. 15 B. 25 C. 20 D. 10
3. What is the Period 1 total across all five units?
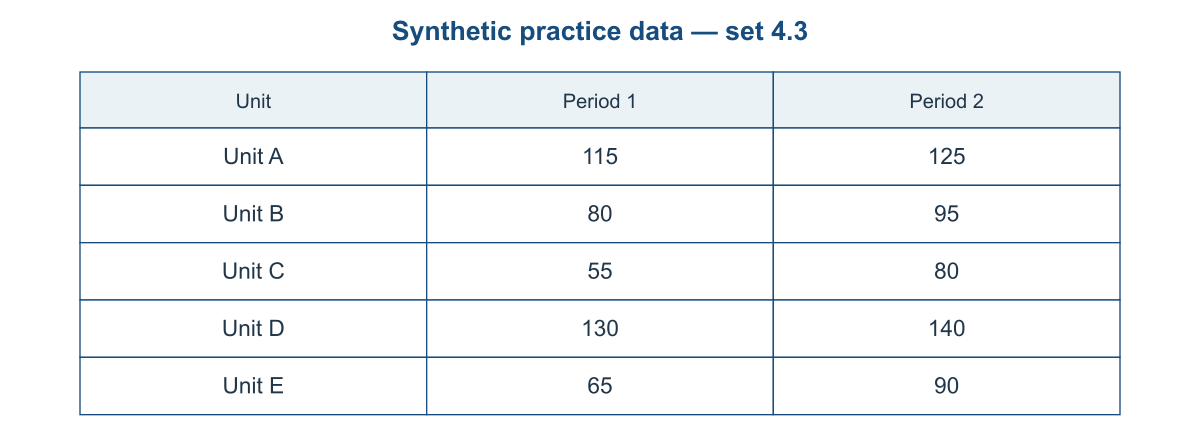
A. 455 B. 450 C. 445 D. 440
4. What is the highest Period 1 value shown?
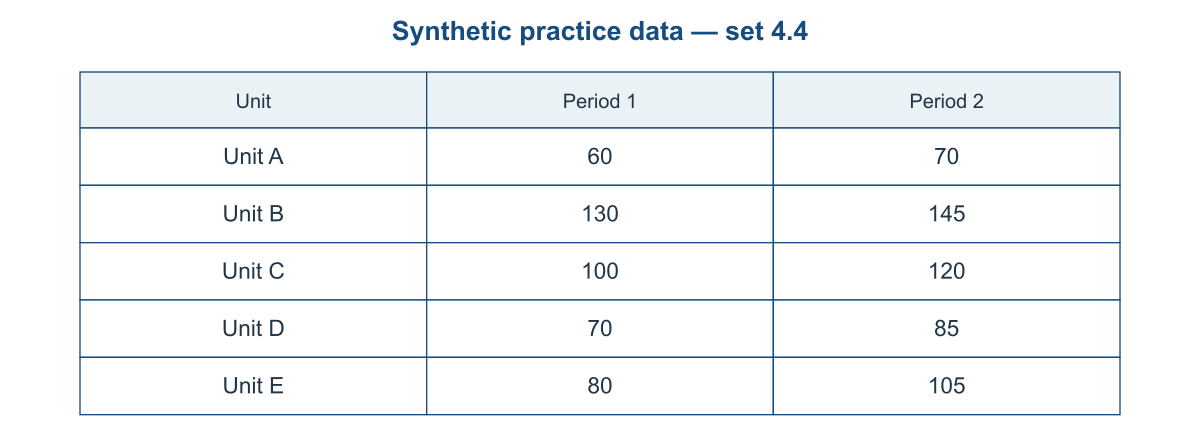
A. 135 B. 130 C. 140 D. 125
5. Add Unit A Period 2 and Unit B Period 1. What is the result?
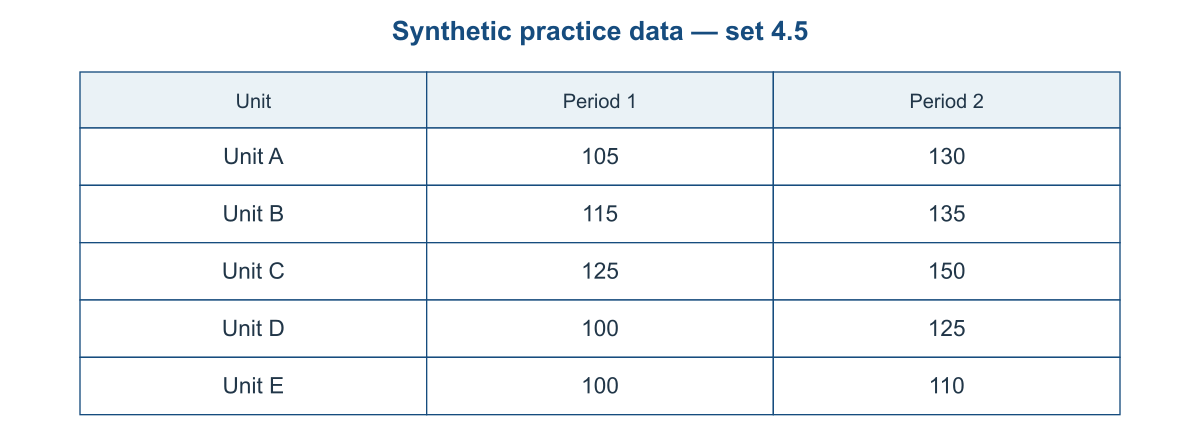
A. 250 B. 245 C. 255 D. 240
6. What is the combined Period 1 value for Unit A and Unit B?
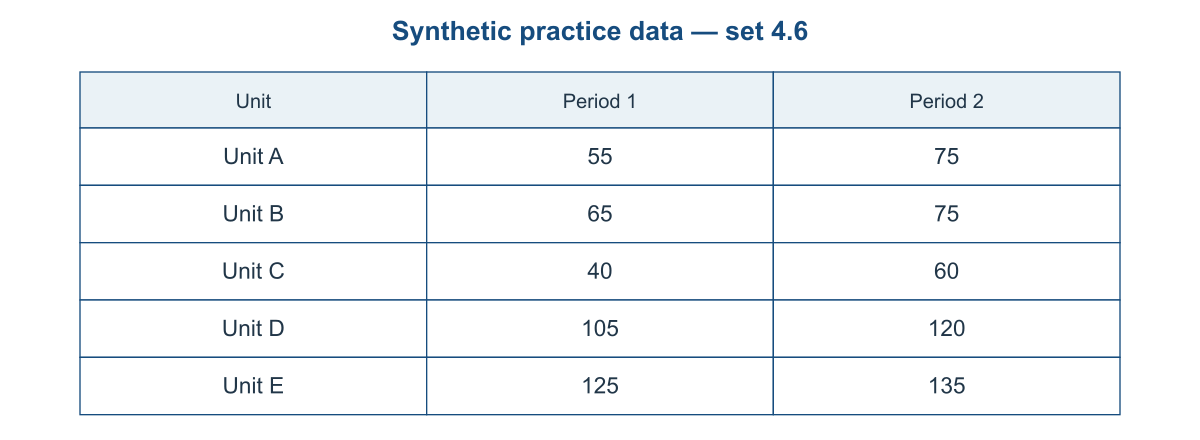
A. 115 B. 130 C. 120 D. 125
7. By how many units did Unit A change from Period 1 to Period 2?
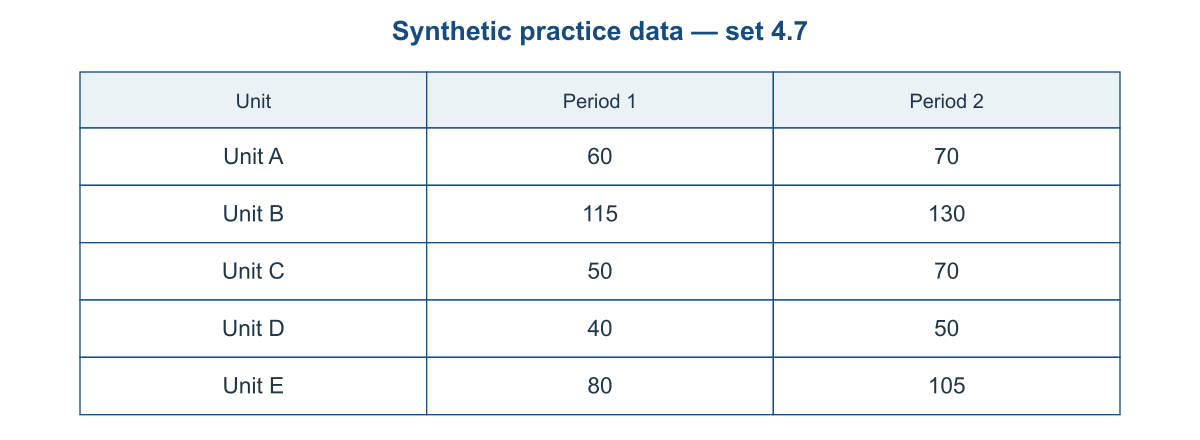
A. 15 B. 5 C. 20 D. 10
8. What is the Period 1 total across all five units?
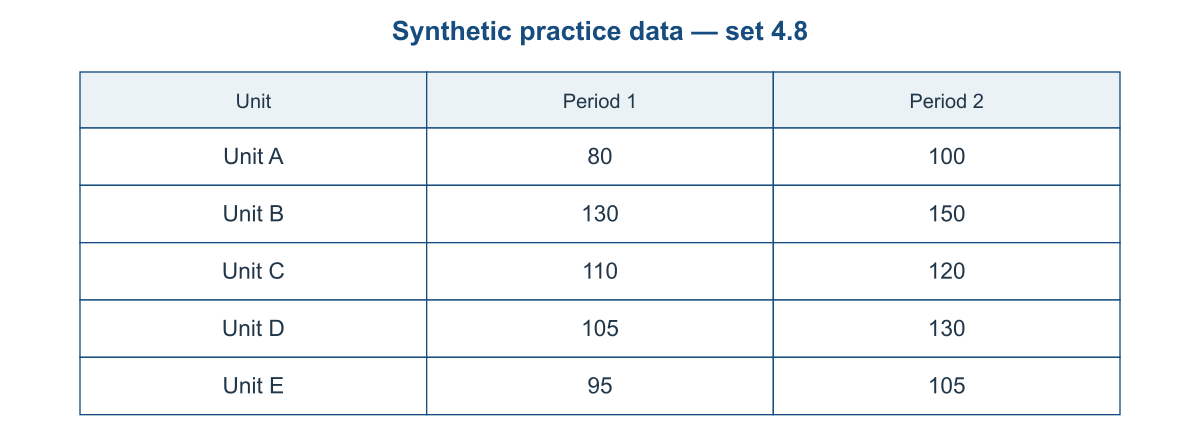
A. 515 B. 525 C. 520 D. 530
9. What is the highest Period 1 value shown?
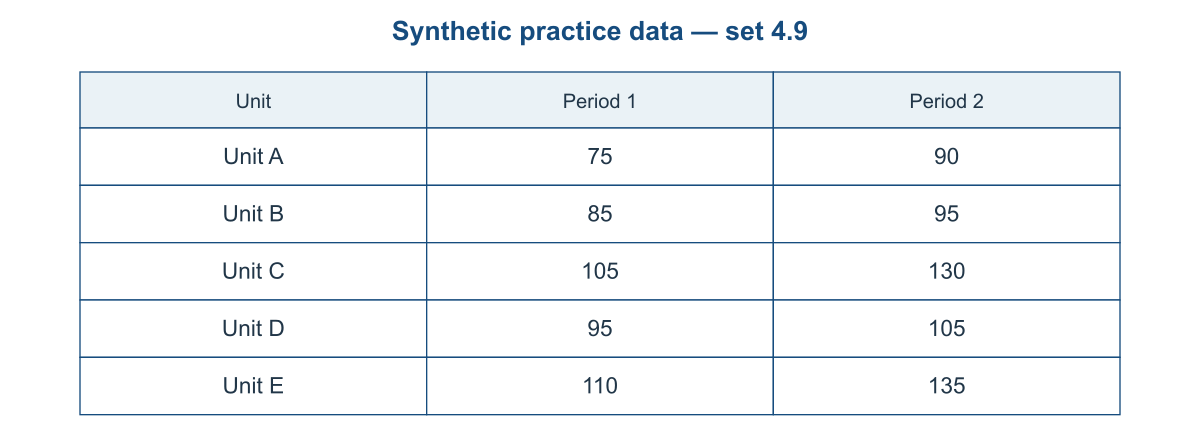
A. 110 B. 115 C. 105 D. 120
10. Add Unit A Period 2 and Unit B Period 1. What is the result?
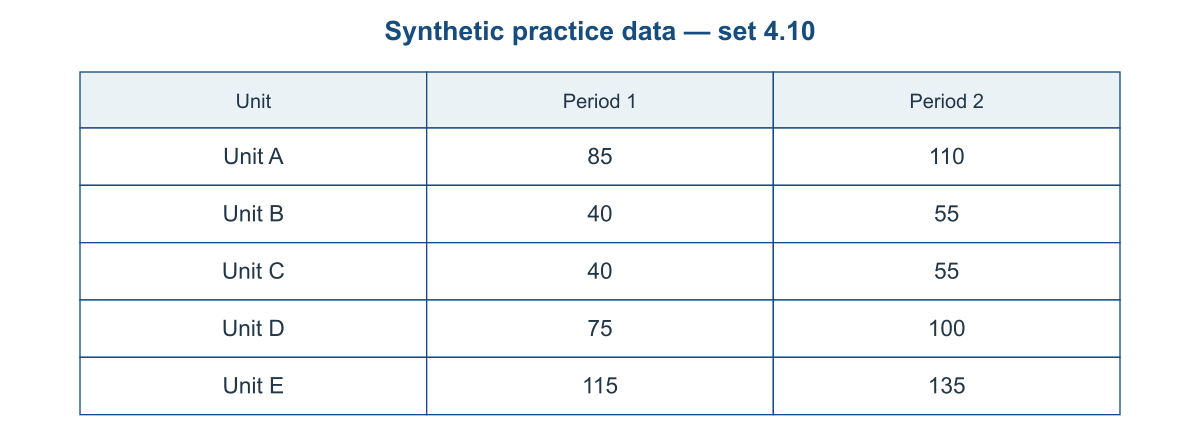
A. 145 B. 160 C. 150 D. 155
11. What is the combined Period 1 value for Unit A and Unit B?
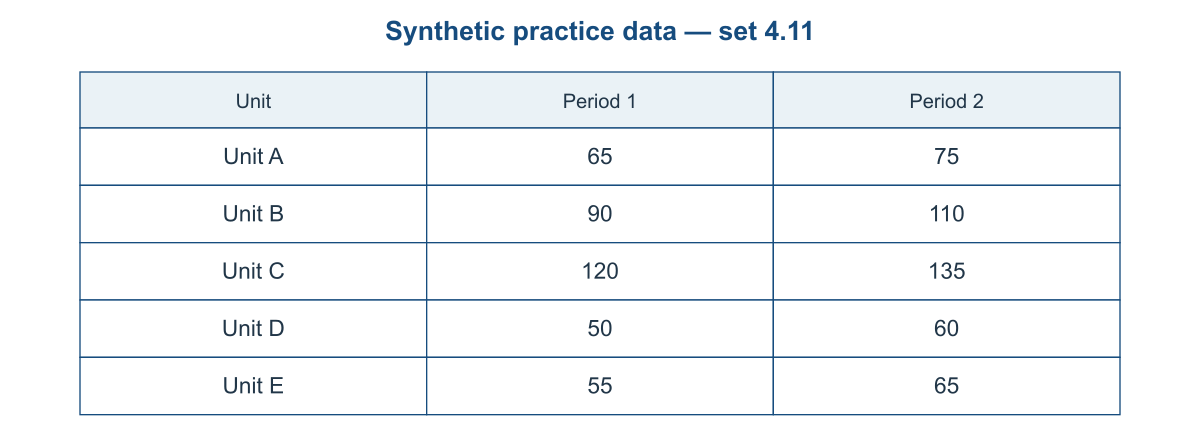
A. 165 B. 150 C. 160 D. 155
12. By how many units did Unit A change from Period 1 to Period 2?
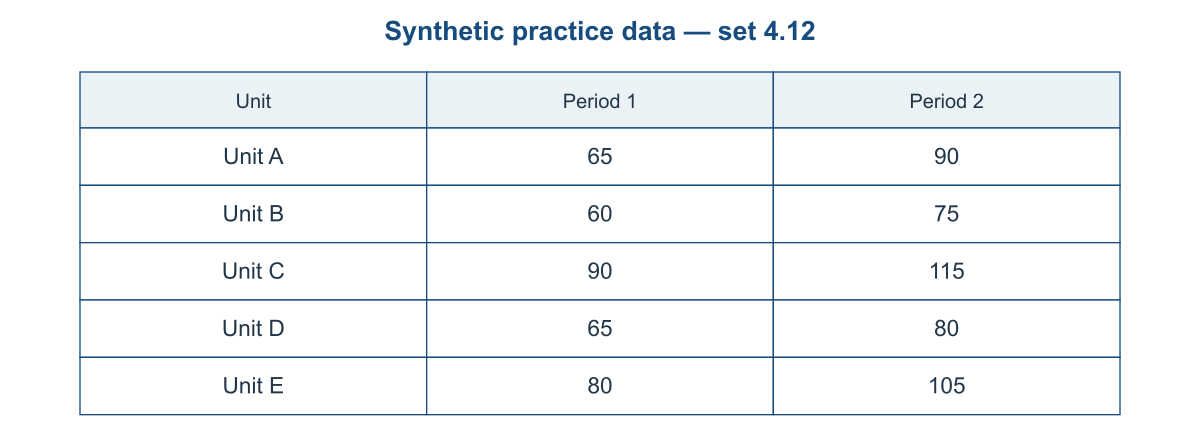
A. 20 B. 35 C. 30 D. 25
13. What is the Period 1 total across all five units?
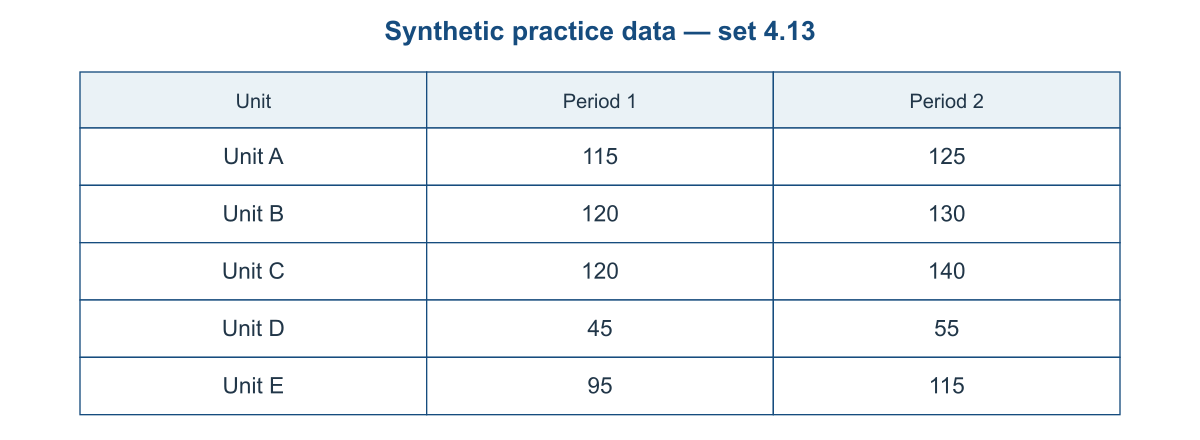
A. 490 B. 500 C. 505 D. 495
14. What is the highest Period 1 value shown?
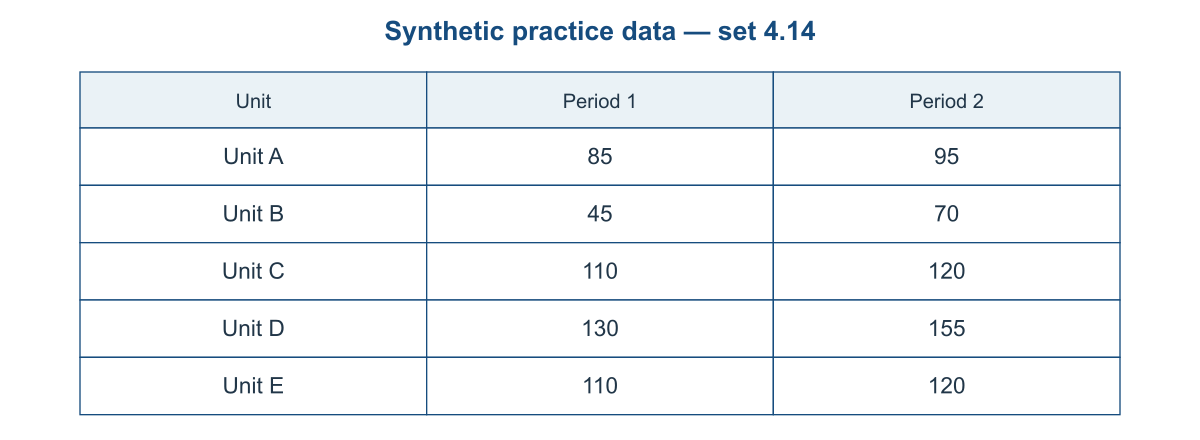
A. 130 B. 135 C. 125 D. 140
15. Add Unit A Period 2 and Unit B Period 1. What is the result?
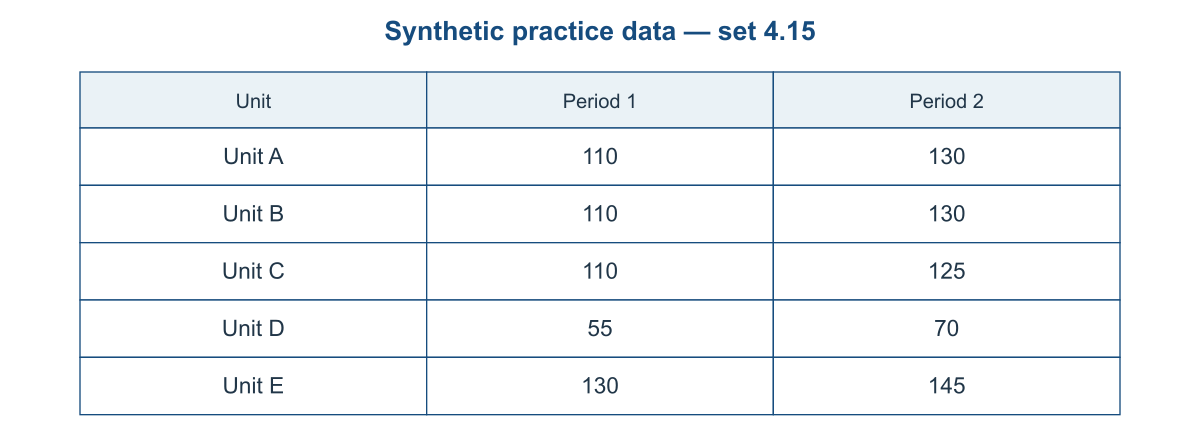
A. 235 B. 245 C. 250 D. 240
16. What is the combined Period 1 value for Unit A and Unit B?
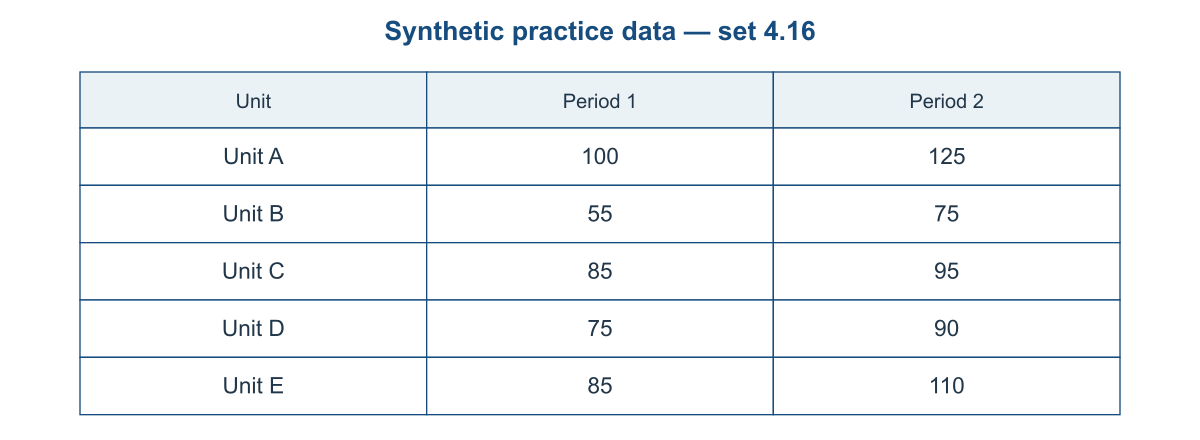
A. 155 B. 150 C. 165 D. 160
17. By how many units did Unit A change from Period 1 to Period 2?
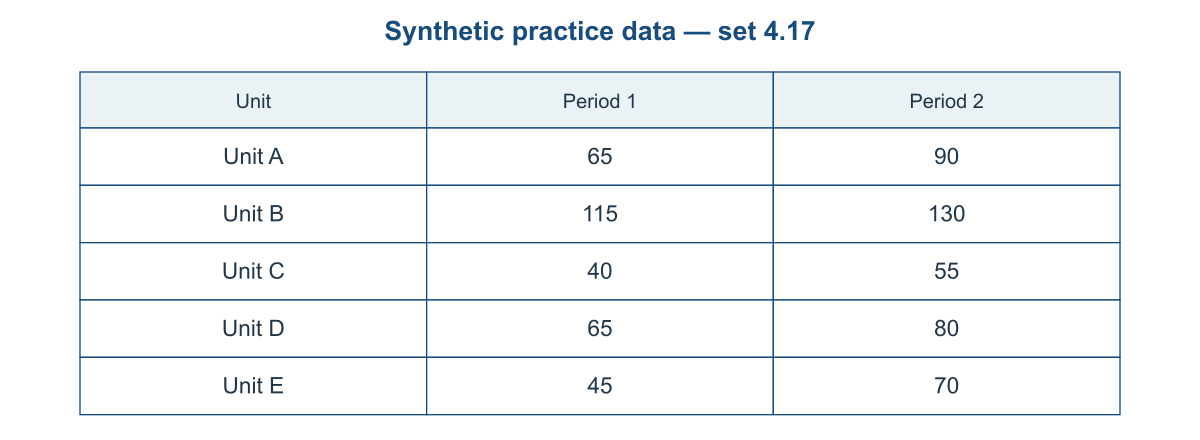
A. 30 B. 20 C. 35 D. 25
18. What is the Period 1 total across all five units?
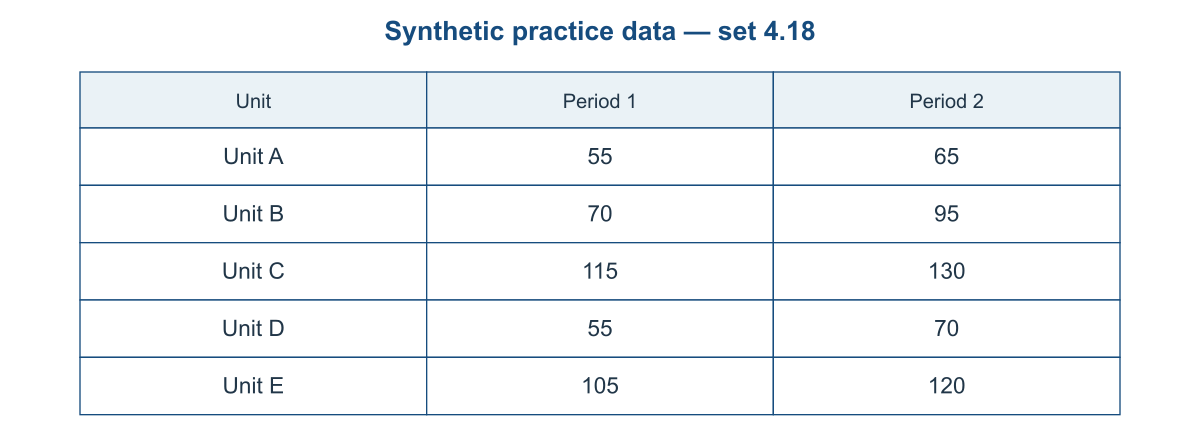
A. 410 B. 395 C. 405 D. 400
19. What is the highest Period 1 value shown?
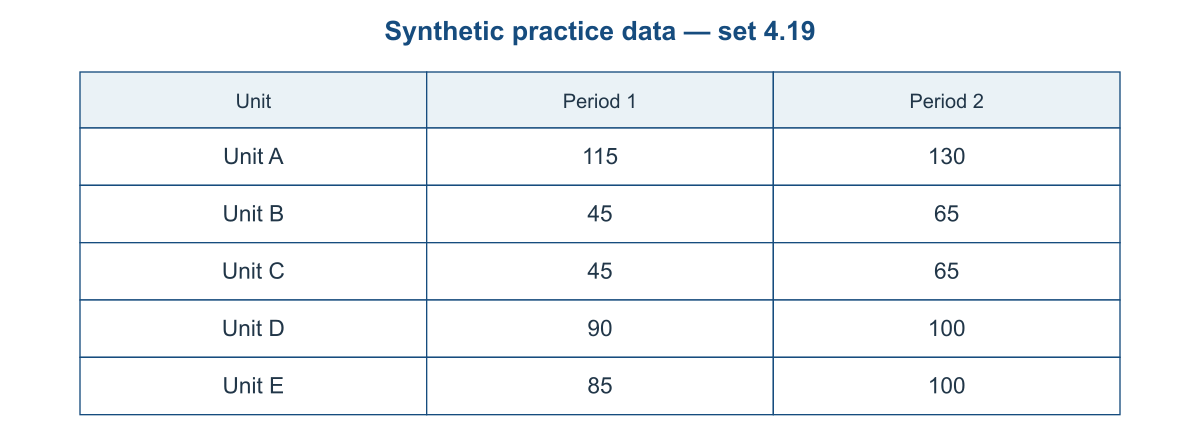
A. 115 B. 125 C. 120 D. 110
20. Add Unit A Period 2 and Unit B Period 1. What is the result?
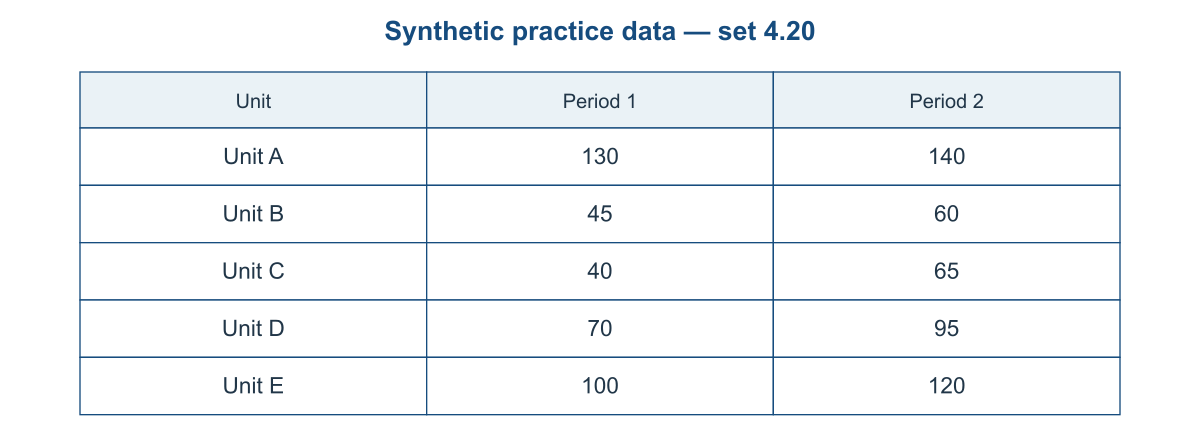
A. 190 B. 180 C. 185 D. 195
21. What is the combined Period 1 value for Unit A and Unit B?
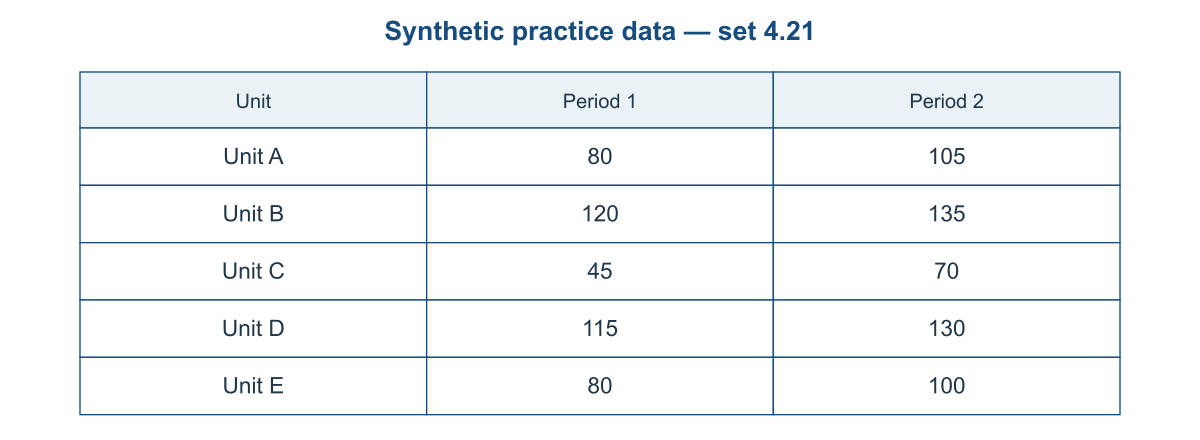
A. 210 B. 205 C. 195 D. 200
22. By how many units did Unit A change from Period 1 to Period 2?
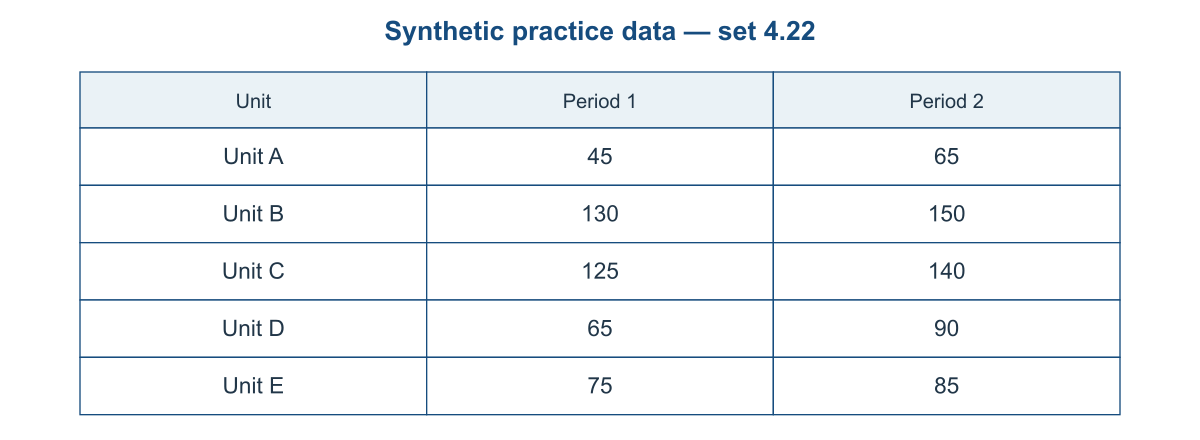
A. 30 B. 20 C. 15 D. 25
23. What is the Period 1 total across all five units?
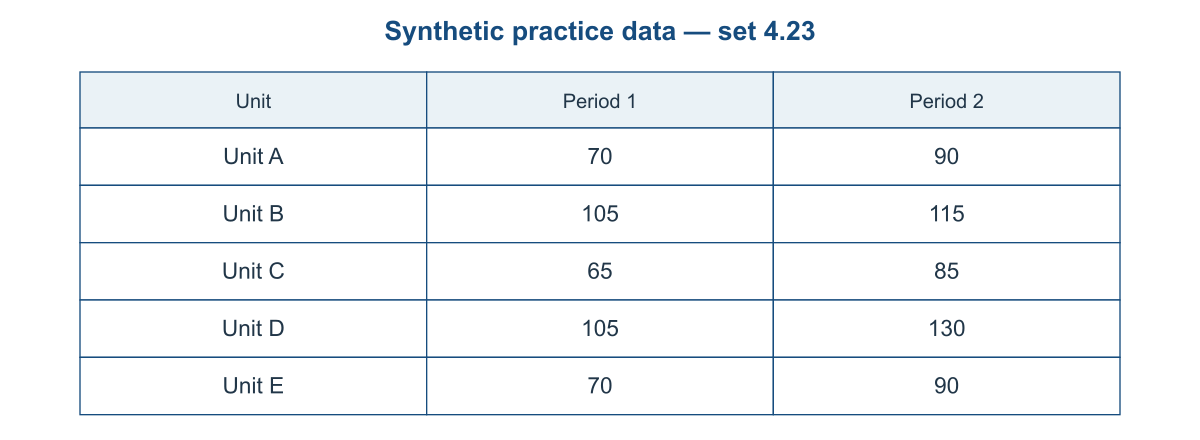
A. 420 B. 415 C. 410 D. 425
24. What is the highest Period 1 value shown?
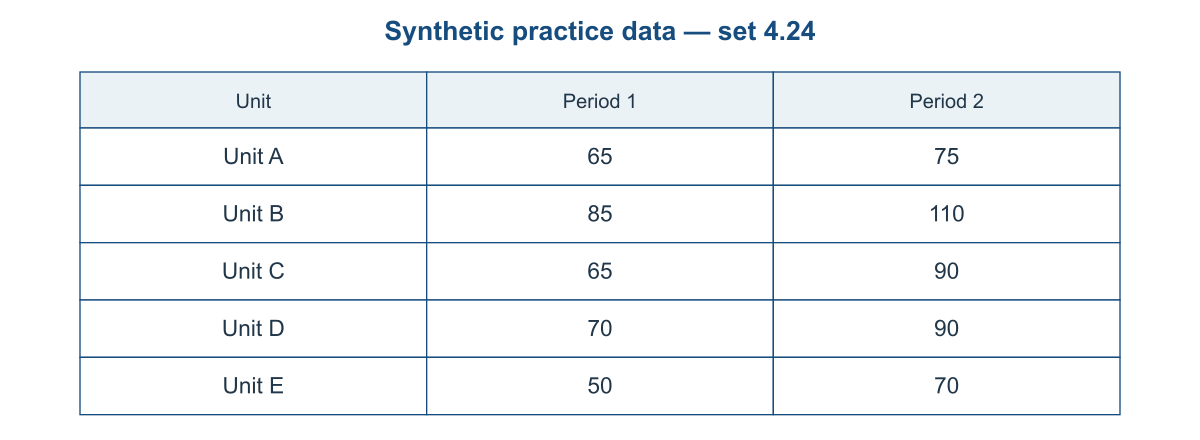
A. 95 B. 90 C. 85 D. 80
25. Add Unit A Period 2 and Unit B Period 1. What is the result?
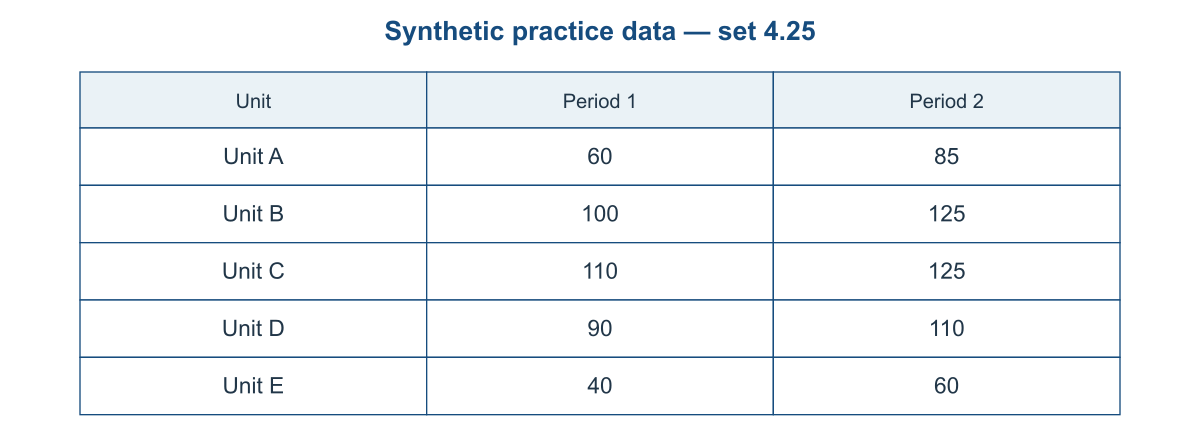
A. 195 B. 185 C. 180 D. 190
26. What is the combined Period 1 value for Unit A and Unit B?
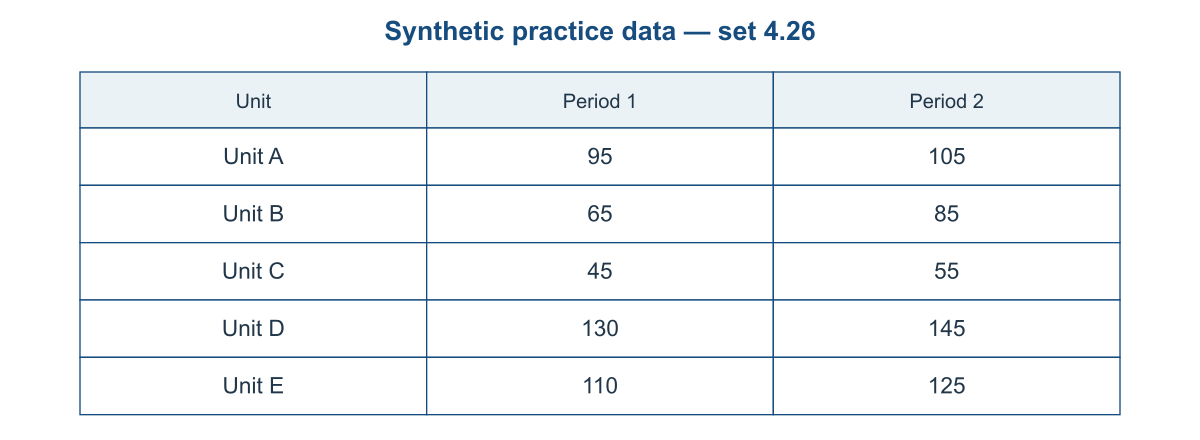
A. 170 B. 160 C. 165 D. 155
27. By how many units did Unit A change from Period 1 to Period 2?
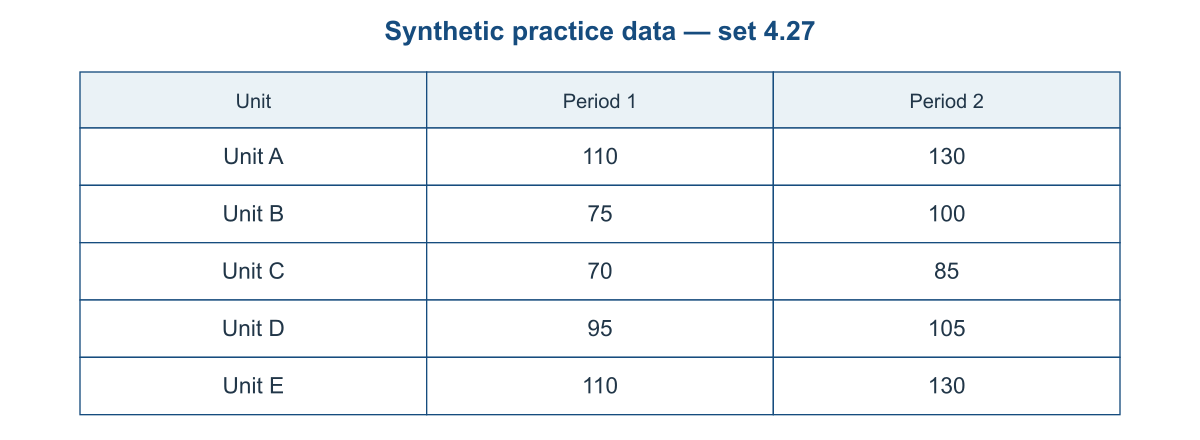
A. 20 B. 30 C. 15 D. 25
28. What is the Period 1 total across all five units?
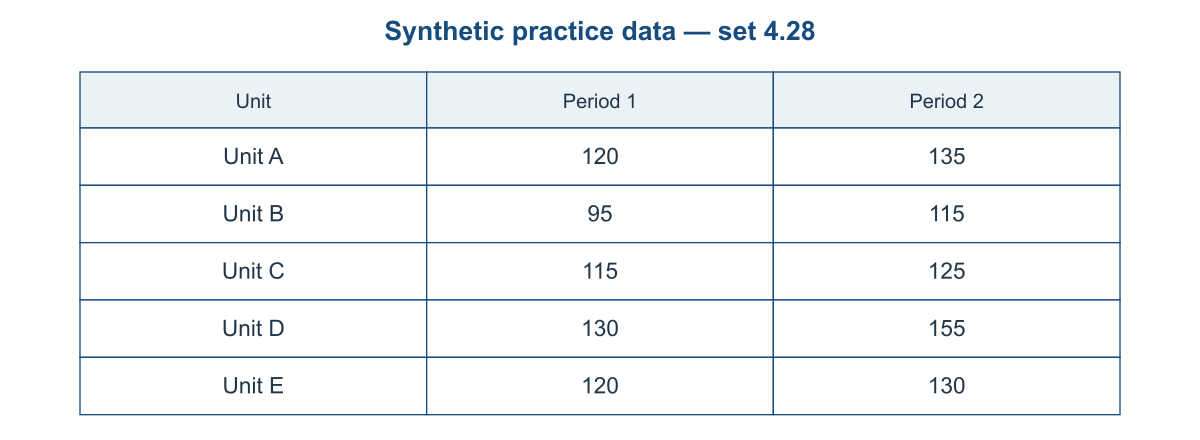
A. 580 B. 585 C. 575 D. 590
29. What is the highest Period 1 value shown?
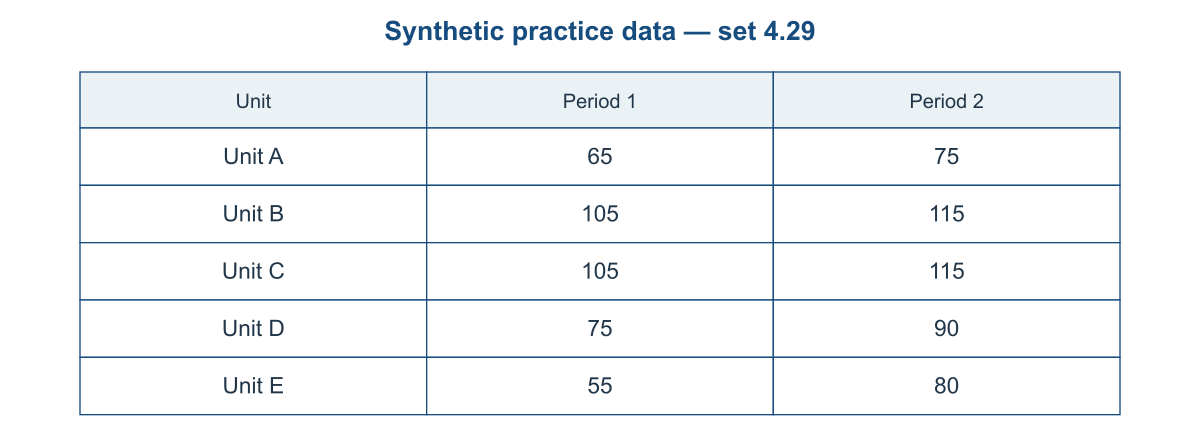
A. 100 B. 115 C. 105 D. 110
30. Add Unit A Period 2 and Unit B Period 1. What is the result?
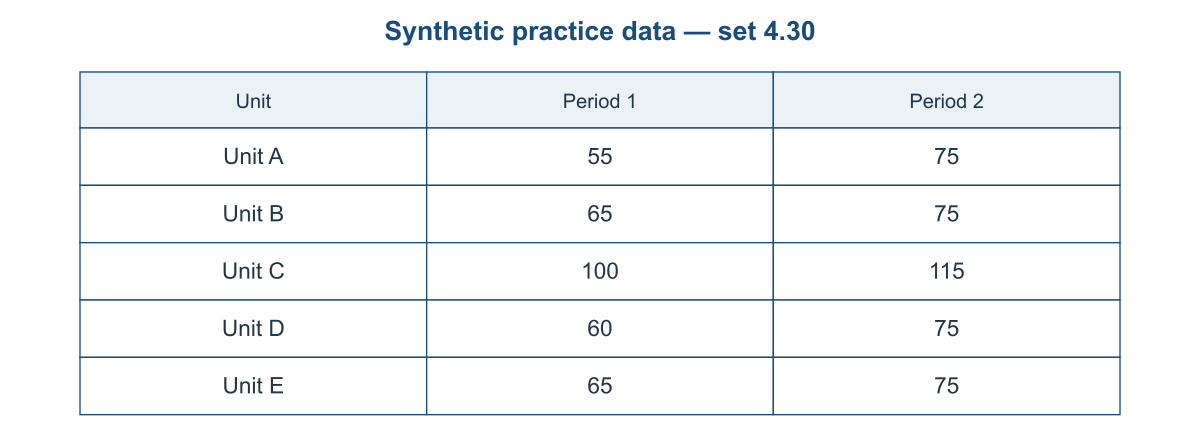
A. 135 B. 150 C. 145 D. 140
31. What is the combined Period 1 value for Unit A and Unit B?
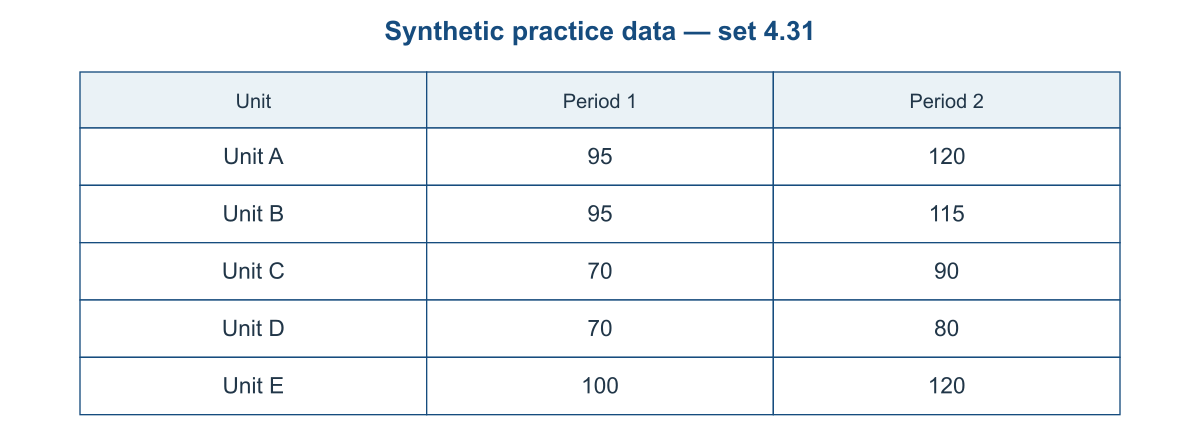
A. 200 B. 185 C. 190 D. 195
32. By how many units did Unit A change from Period 1 to Period 2?
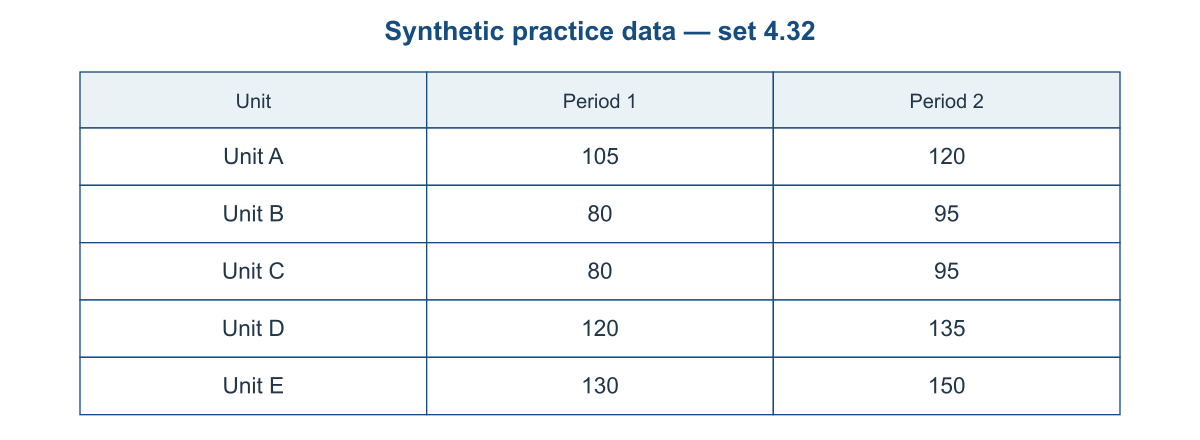
A. 15 B. 25 C. 20 D. 10
33. What is the Period 1 total across all five units?
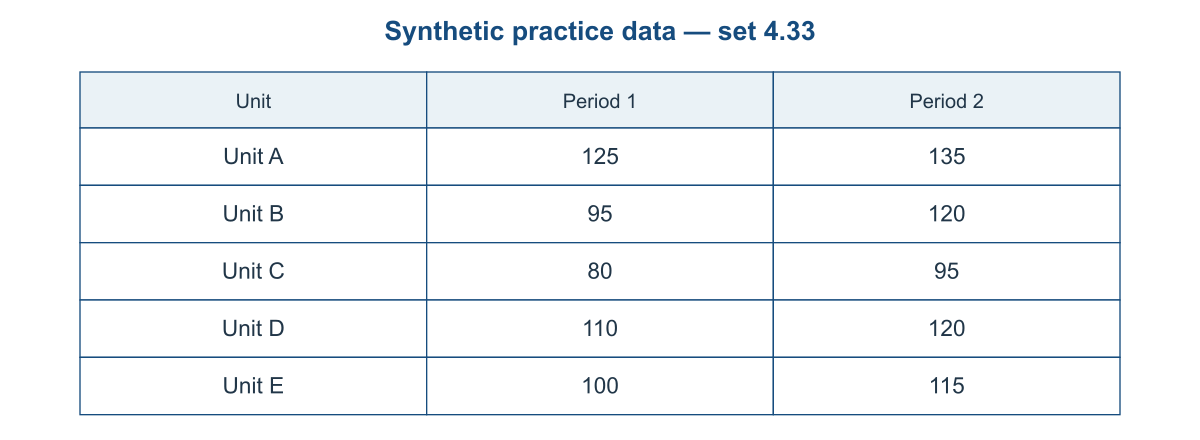
A. 510 B. 515 C. 505 D. 520
34. What is the highest Period 1 value shown?
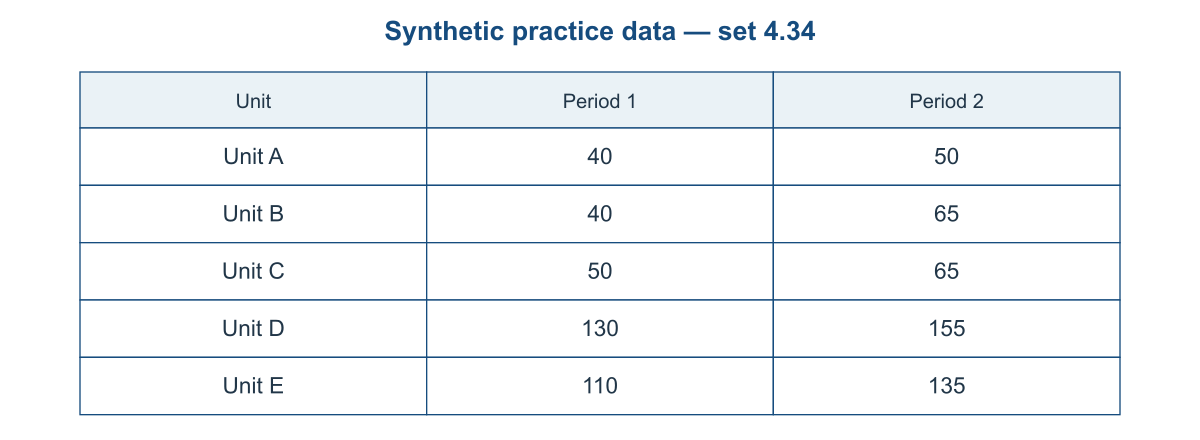
A. 125 B. 135 C. 130 D. 140
35. Add Unit A Period 2 and Unit B Period 1. What is the result?
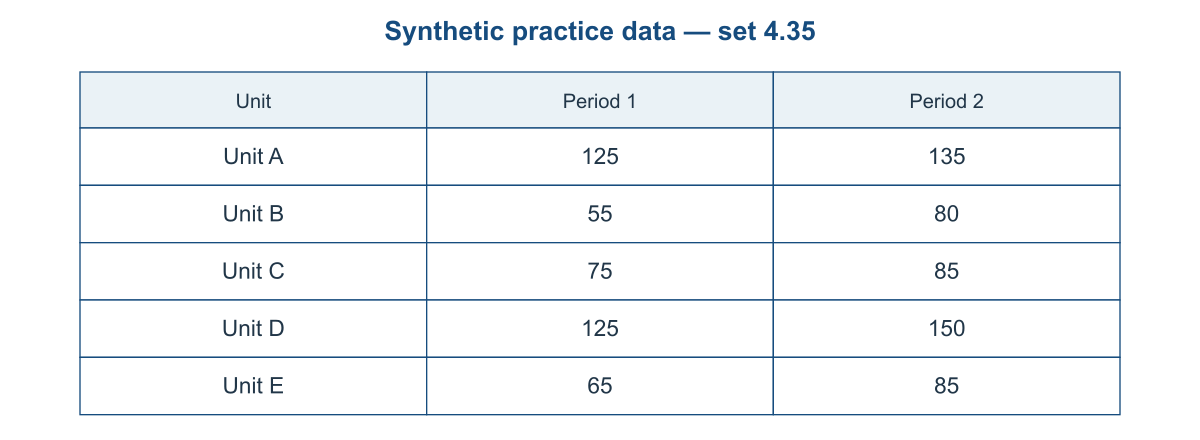
A. 185 B. 200 C. 190 D. 195
36. What is the combined Period 1 value for Unit A and Unit B?
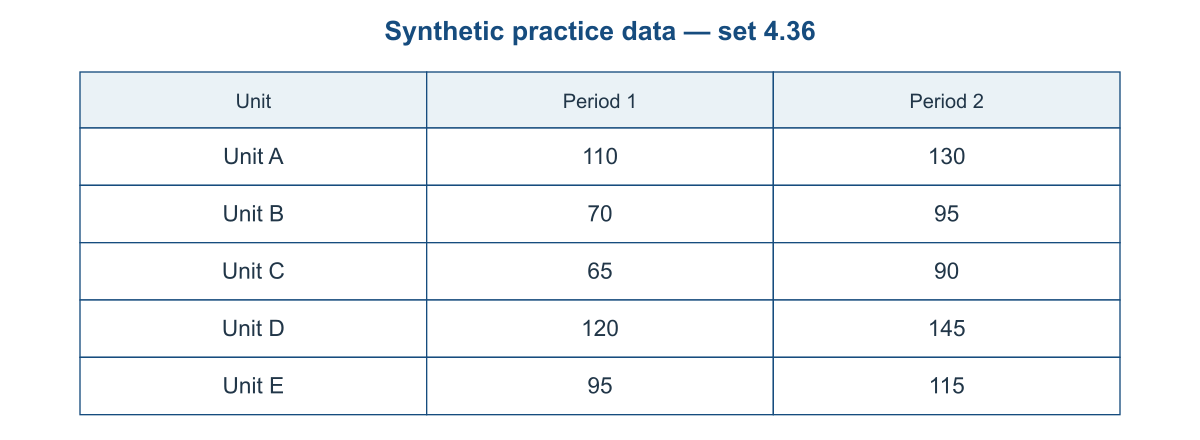
A. 185 B. 175 C. 190 D. 180
37. By how many units did Unit A change from Period 1 to Period 2?
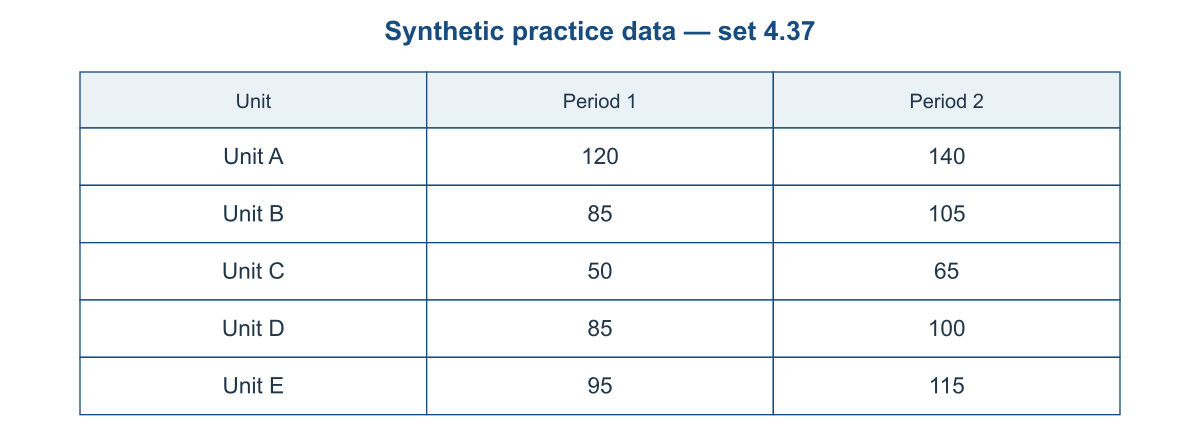
A. 20 B. 25 C. 15 D. 30
38. What is the Period 1 total across all five units?
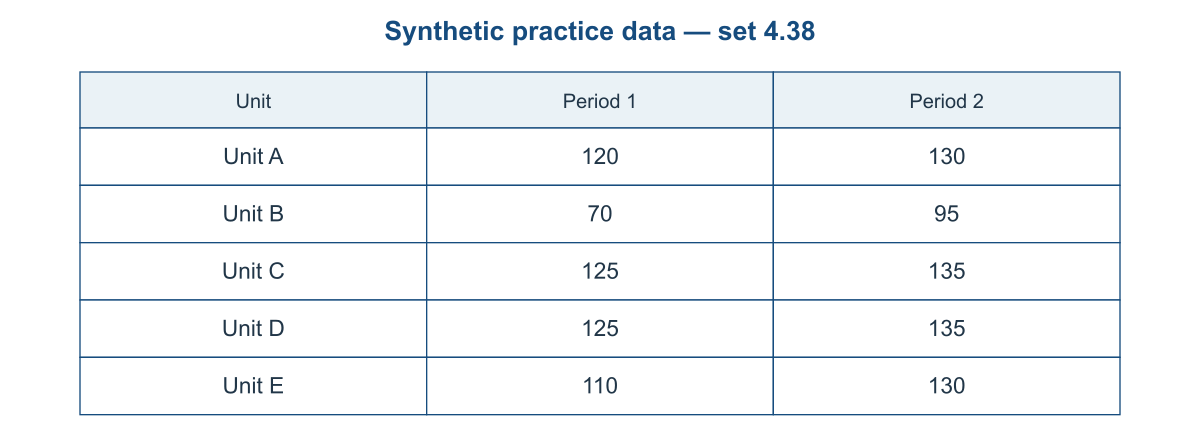
A. 550 B. 555 C. 545 D. 560
39. What is the highest Period 1 value shown?
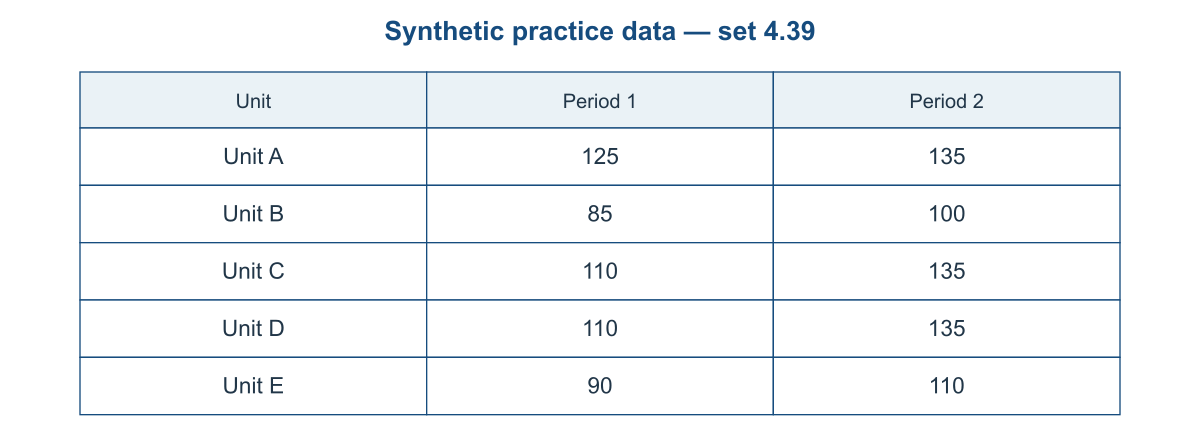
A. 130 B. 135 C. 125 D. 120
40. Add Unit A Period 2 and Unit B Period 1. What is the result?
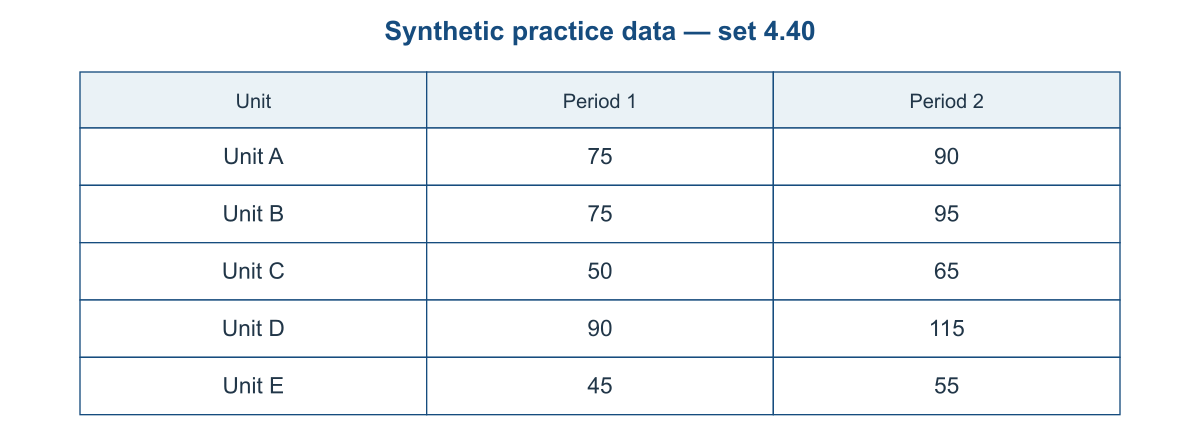
A. 175 B. 170 C. 165 D. 160
41. What is the combined Period 1 value for Unit A and Unit B?
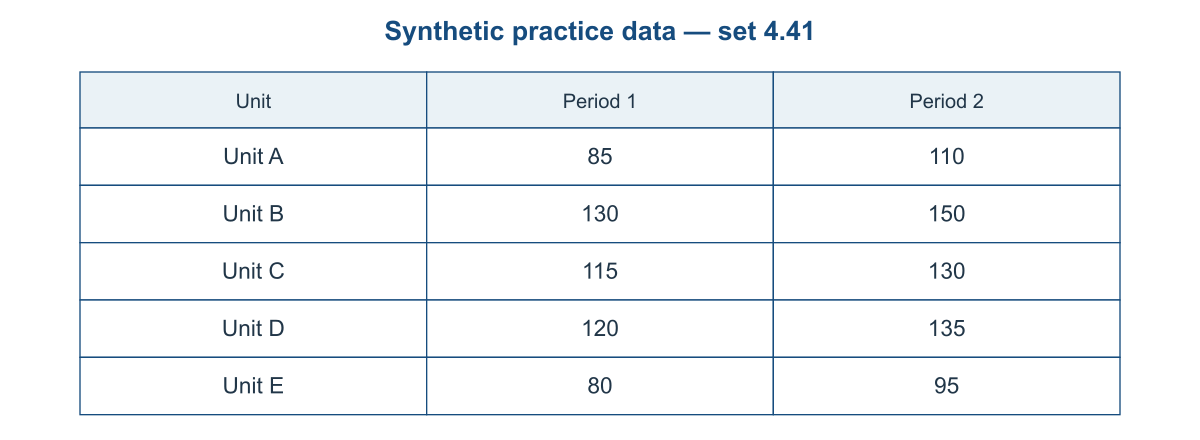
A. 210 B. 225 C. 220 D. 215
42. By how many units did Unit A change from Period 1 to Period 2?
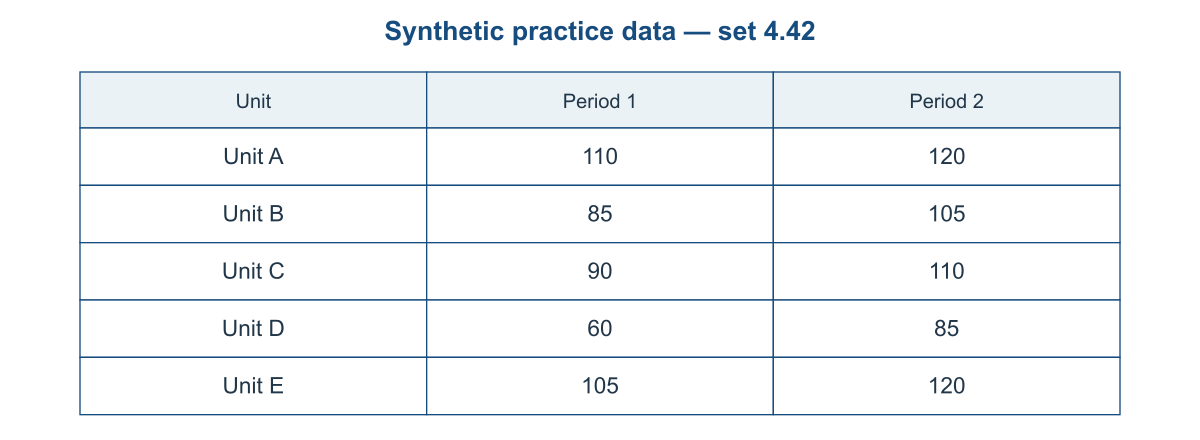
A. 15 B. 20 C. 10 D. 5
43. What is the Period 1 total across all five units?
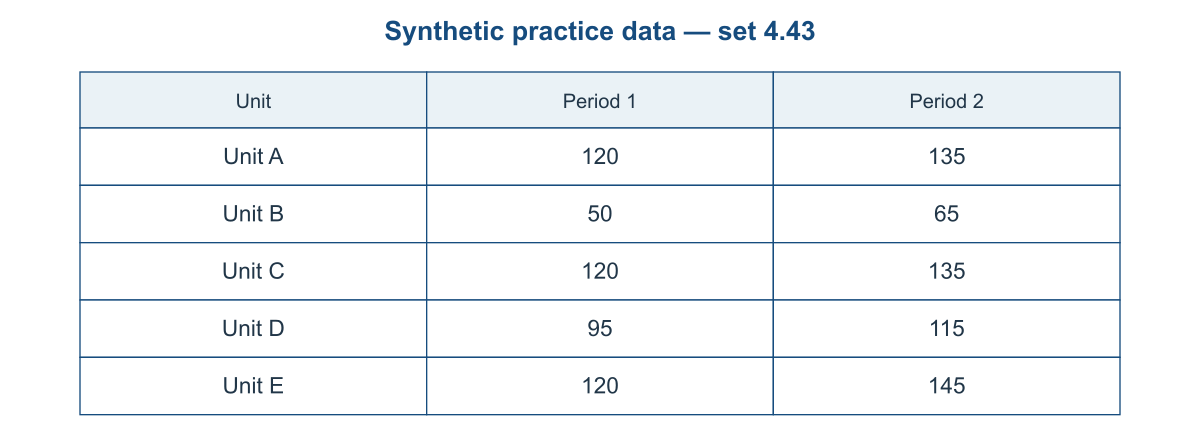
A. 515 B. 510 C. 500 D. 505
44. What is the highest Period 1 value shown?
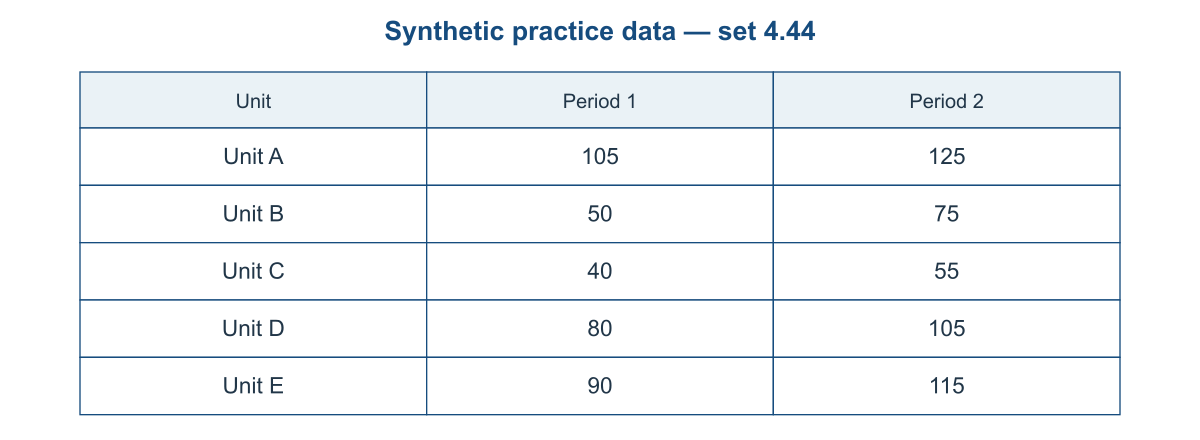
A. 110 B. 100 C. 115 D. 105
45. Add Unit A Period 2 and Unit B Period 1. What is the result?
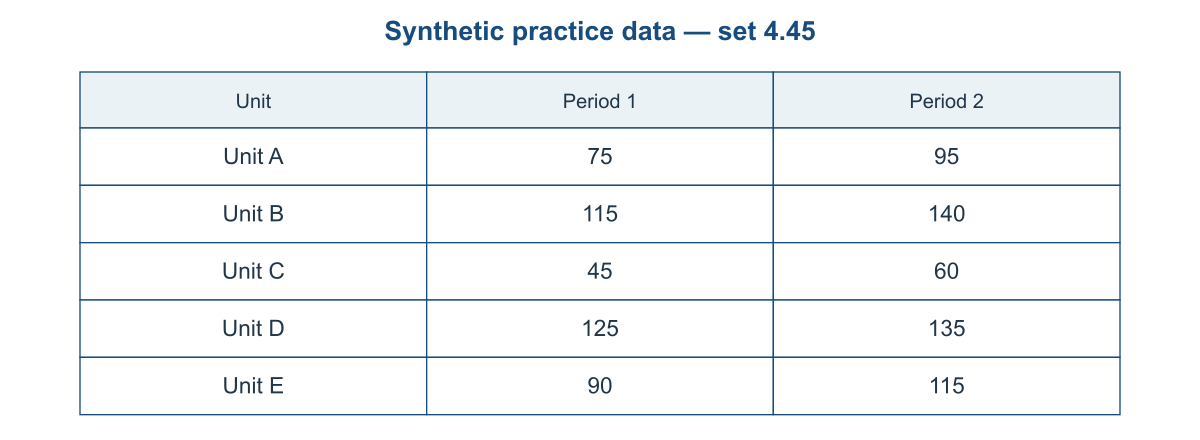
A. 220 B. 205 C. 210 D. 215
46. What is the combined Period 1 value for Unit A and Unit B?
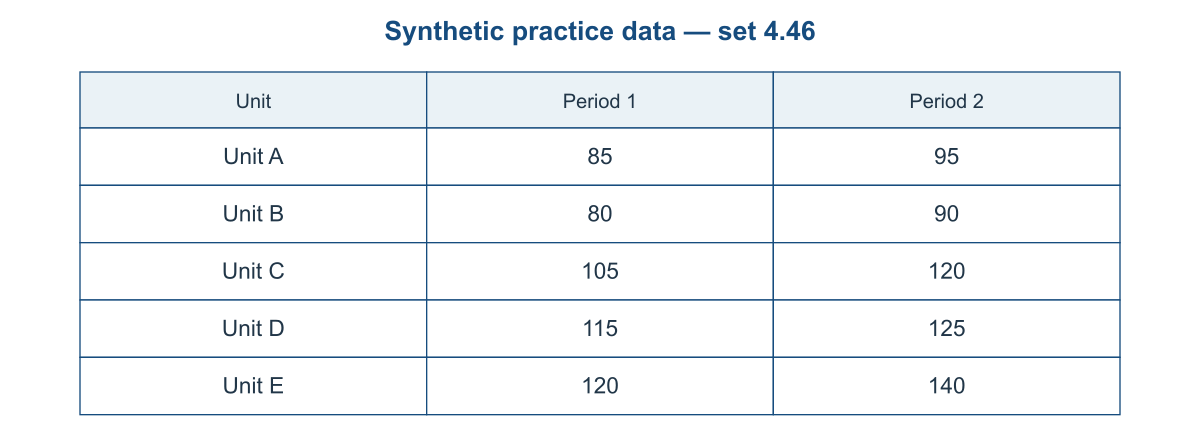
A. 175 B. 165 C. 170 D. 160
47. By how many units did Unit A change from Period 1 to Period 2?
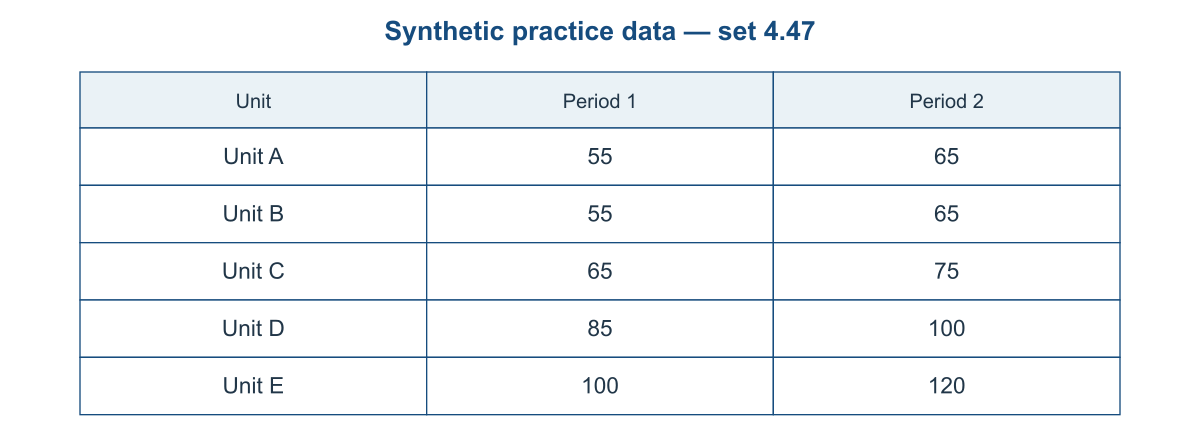
A. 5 B. 10 C. 15 D. 20
48. What is the Period 1 total across all five units?
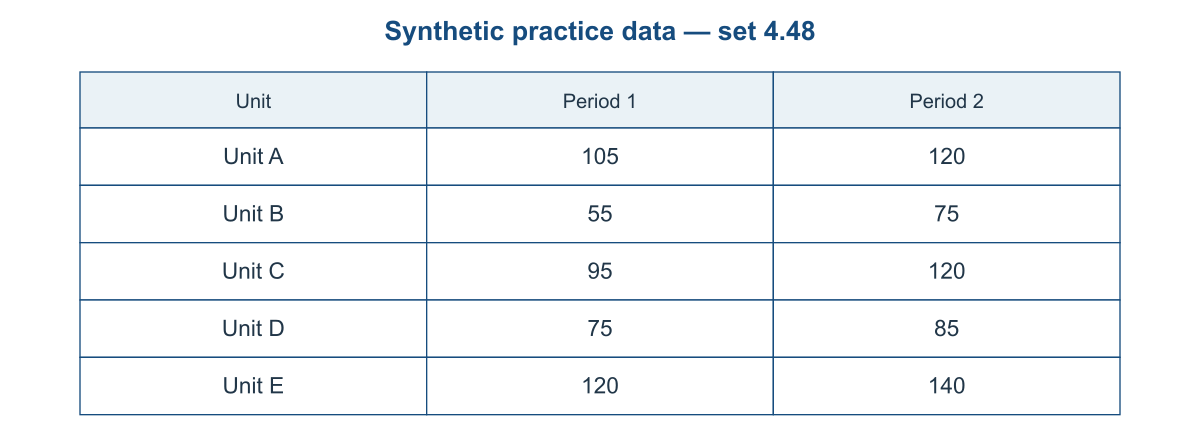
A. 445 B. 460 C. 455 D. 450
49. What is the highest Period 1 value shown?
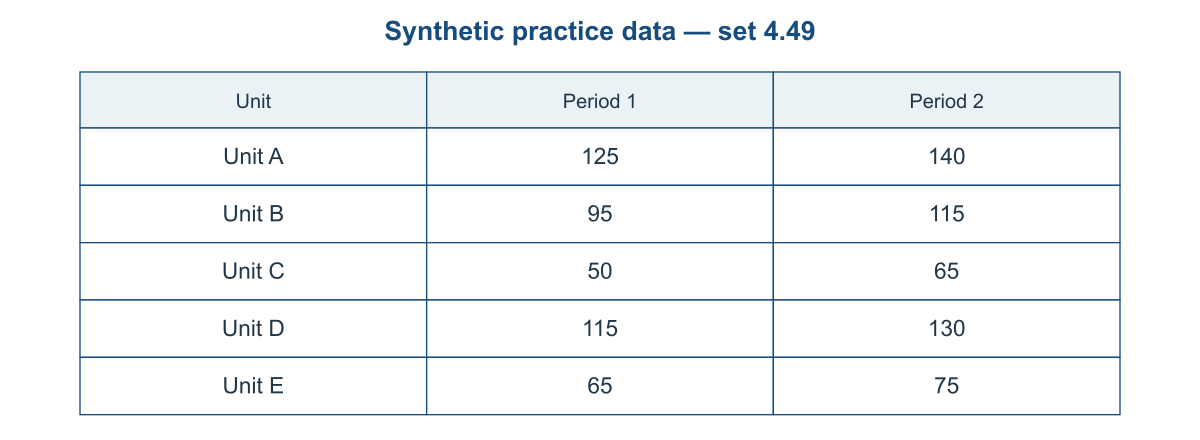
A. 130 B. 125 C. 135 D. 120
50. Add Unit A Period 2 and Unit B Period 1. What is the result?
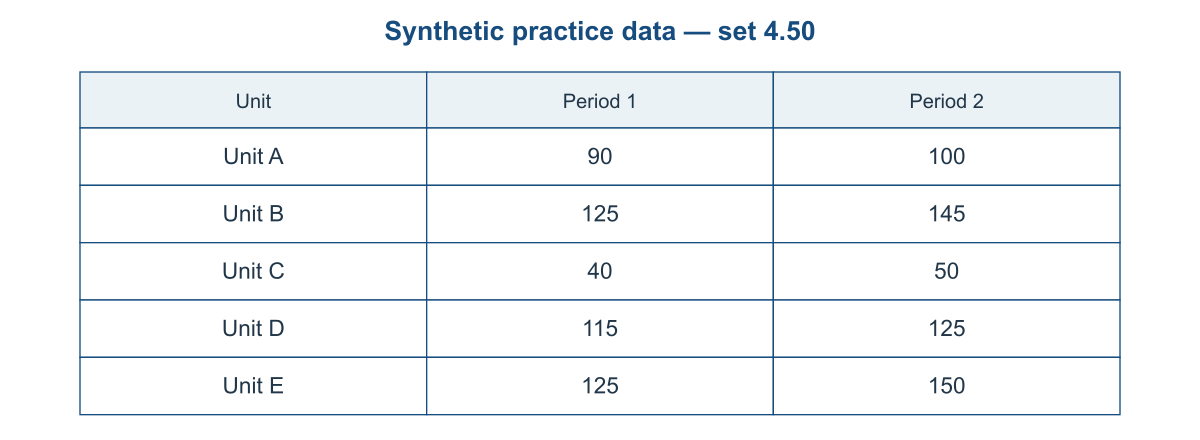
A. 230 B. 220 C. 225 D. 235
Answers and explanations
Check the value and the unit before comparing your working with the calculation.
1. C. Read Period 1 in the Unit A and B rows: 100+85=185 units.
APDI26-04-01 | table-charts | Easy
2. A. Unit A changes from 55 to 70. Subtract: 70−55=15 units.
APDI26-04-02 | table-charts | Easy
3. C. Add the five Period 1 entries [115, 80, 55, 130, 65]: total 445 units.
APDI26-04-03 | table-charts | Easy
4. B. The Period 1 entries are [60, 130, 100, 70, 80]; the maximum is 130 units.
APDI26-04-04 | table-charts | Easy
5. B. The requested cells contain 130 and 115; their sum is 245 units.
APDI26-04-05 | table-charts | Easy
6. C. Read Period 1 in the Unit A and B rows: 55+65=120 units.
APDI26-04-06 | table-charts | Easy
7. D. Unit A changes from 60 to 70. Subtract: 70−60=10 units.
APDI26-04-07 | table-charts | Easy
8. C. Add the five Period 1 entries [80, 130, 110, 105, 95]: total 520 units.
APDI26-04-08 | table-charts | Easy
9. A. The Period 1 entries are [75, 85, 105, 95, 110]; the maximum is 110 units.
APDI26-04-09 | table-charts | Easy
10. C. The requested cells contain 110 and 40; their sum is 150 units.
APDI26-04-10 | table-charts | Easy
11. D. Read Period 1 in the Unit A and B rows: 65+90=155 units.
APDI26-04-11 | table-charts | Easy
12. D. Unit A changes from 65 to 90. Subtract: 90−65=25 units.
APDI26-04-12 | table-charts | Easy
13. D. Add the five Period 1 entries [115, 120, 120, 45, 95]: total 495 units.
APDI26-04-13 | table-charts | Easy
14. A. The Period 1 entries are [85, 45, 110, 130, 110]; the maximum is 130 units.
APDI26-04-14 | table-charts | Easy
15. D. The requested cells contain 130 and 110; their sum is 240 units.
APDI26-04-15 | table-charts | Easy
16. A. Read Period 1 in the Unit A and B rows: 100+55=155 units.
APDI26-04-16 | table-charts | Medium
17. D. Unit A changes from 65 to 90. Subtract: 90−65=25 units.
APDI26-04-17 | table-charts | Medium
18. D. Add the five Period 1 entries [55, 70, 115, 55, 105]: total 400 units.
APDI26-04-18 | table-charts | Medium
19. A. The Period 1 entries are [115, 45, 45, 90, 85]; the maximum is 115 units.
APDI26-04-19 | table-charts | Medium
20. C. The requested cells contain 140 and 45; their sum is 185 units.
APDI26-04-20 | table-charts | Medium
21. D. Read Period 1 in the Unit A and B rows: 80+120=200 units.
APDI26-04-21 | table-charts | Medium
22. B. Unit A changes from 45 to 65. Subtract: 65−45=20 units.
APDI26-04-22 | table-charts | Medium
23. B. Add the five Period 1 entries [70, 105, 65, 105, 70]: total 415 units.
APDI26-04-23 | table-charts | Medium
24. C. The Period 1 entries are [65, 85, 65, 70, 50]; the maximum is 85 units.
APDI26-04-24 | table-charts | Medium
25. B. The requested cells contain 85 and 100; their sum is 185 units.
APDI26-04-25 | table-charts | Medium
26. B. Read Period 1 in the Unit A and B rows: 95+65=160 units.
APDI26-04-26 | table-charts | Medium
27. A. Unit A changes from 110 to 130. Subtract: 130−110=20 units.
APDI26-04-27 | table-charts | Medium
28. A. Add the five Period 1 entries [120, 95, 115, 130, 120]: total 580 units.
APDI26-04-28 | table-charts | Medium
29. C. The Period 1 entries are [65, 105, 105, 75, 55]; the maximum is 105 units.
APDI26-04-29 | table-charts | Medium
30. D. The requested cells contain 75 and 65; their sum is 140 units.
APDI26-04-30 | table-charts | Medium
31. C. Read Period 1 in the Unit A and B rows: 95+95=190 units.
APDI26-04-31 | table-charts | Medium
32. A. Unit A changes from 105 to 120. Subtract: 120−105=15 units.
APDI26-04-32 | table-charts | Medium
33. A. Add the five Period 1 entries [125, 95, 80, 110, 100]: total 510 units.
APDI26-04-33 | table-charts | Medium
34. C. The Period 1 entries are [40, 40, 50, 130, 110]; the maximum is 130 units.
APDI26-04-34 | table-charts | Medium
35. C. The requested cells contain 135 and 55; their sum is 190 units.
APDI26-04-35 | table-charts | Medium
36. D. Read Period 1 in the Unit A and B rows: 110+70=180 units.
APDI26-04-36 | table-charts | Medium
37. A. Unit A changes from 120 to 140. Subtract: 140−120=20 units.
APDI26-04-37 | table-charts | Medium
38. A. Add the five Period 1 entries [120, 70, 125, 125, 110]: total 550 units.
APDI26-04-38 | table-charts | Medium
39. C. The Period 1 entries are [125, 85, 110, 110, 90]; the maximum is 125 units.
APDI26-04-39 | table-charts | Medium
40. C. The requested cells contain 90 and 75; their sum is 165 units.
APDI26-04-40 | table-charts | Medium
41. D. Read Period 1 in the Unit A and B rows: 85+130=215 units.
APDI26-04-41 | table-charts | Difficult
42. C. Unit A changes from 110 to 120. Subtract: 120−110=10 units.
APDI26-04-42 | table-charts | Difficult
43. D. Add the five Period 1 entries [120, 50, 120, 95, 120]: total 505 units.
APDI26-04-43 | table-charts | Difficult
44. D. The Period 1 entries are [105, 50, 40, 80, 90]; the maximum is 105 units.
APDI26-04-44 | table-charts | Difficult
45. C. The requested cells contain 95 and 115; their sum is 210 units.
APDI26-04-45 | table-charts | Difficult
46. B. Read Period 1 in the Unit A and B rows: 85+80=165 units.
APDI26-04-46 | table-charts | Difficult
47. B. Unit A changes from 55 to 65. Subtract: 65−55=10 units.
APDI26-04-47 | table-charts | Difficult
48. D. Add the five Period 1 entries [105, 55, 95, 75, 120]: total 450 units.
APDI26-04-48 | table-charts | Difficult
49. B. The Period 1 entries are [125, 95, 50, 115, 65]; the maximum is 125 units.
APDI26-04-49 | table-charts | Difficult
50. C. The requested cells contain 100 and 125; their sum is 225 units.
APDI26-04-50 | table-charts | Difficult