Follow the labelled points
A line chart connects values across an ordered variable, usually time. The line between points helps show a trend but does not always authorise reading an unstated intermediate value. Identify the horizontal unit, vertical unit and each series label. For two series, trace one colour or line style at a time. A rise between consecutive points is a difference; a percent rise divides that difference by the earlier point.
Trend questions need precise language
“Highest value” asks for the largest plotted point. “Greatest rise” asks for the largest positive adjacent difference, which may occur on a line whose highest value is elsewhere. “Steepest percentage rise” compares proportional changes, not absolute slopes alone. If values move from 20 to 30 and from 200 to 220, the second has a bigger unit rise (20) but the first has a bigger percent rise (50% versus 10%).
Aggregate across periods
To find a total over five years, add the five labelled points; do not multiply the last point by five. To find the mean, divide that total by five. If a question compares two series over a range, use the same years for both. When the graph scale is dense, write a short two-column list of only the needed points. In review, trace the correct series with your finger and state whether the error was series identity, interval, unit or base.
Endpoint change and intermediate movement
A five-year line may read 40, 55, 50, 80 and 70. The overall change from Year 1 to Year 5 is 70−40=30, although the line rises and falls along the way. The largest one-year increase is 80−50=30, from Year 3 to Year 4. The largest one-year fall is 80−70=10, from Year 4 to Year 5. The end-to-end change and the largest adjacent change happen to share a number here, but they answer different questions. Always mark the named endpoints.
The five-year total is 40+55+50+80+70=295, and the mean is 59. Neither is the value at any one year. If a question asks for the percentage increase from Year 1 to Year 5, divide 30 by the starting 40 to get 75%. A percentage change from Year 5 back to Year 1 would divide the 30-unit fall by 70, about 42.9%. Direction changes the denominator.
Do not overread a connecting line
The segment between Year 2 and Year 3 makes the trend visible, but a line chart with annual observations does not prove the exact value halfway through that interval. Interpolation is only justified if the question or model permits it. The visual height can also be misleading if the vertical axis begins above zero. Use the point labels when printed, then use the grid for a rough check. For two-line graphs, first locate the right legend colour or line style; then compare values at the same year.
Quick trend language
“Increasing throughout” requires every adjacent step to rise. “Overall increase” only compares first and last. “Peak” asks for the highest labelled point, while “steepest rise” asks for the largest adjacent difference, not simply the highest point. Practice rewriting each phrase as a calculation before inspecting options. If the graph shows a ratio between two series, make sure both series have the same unit and axis before dividing their values.
Practice — 50 questions
Attempt every item before reading the answers. Use the chart or caselet printed with the question.
1. What is the absolute change from Year 1 to Year 5?
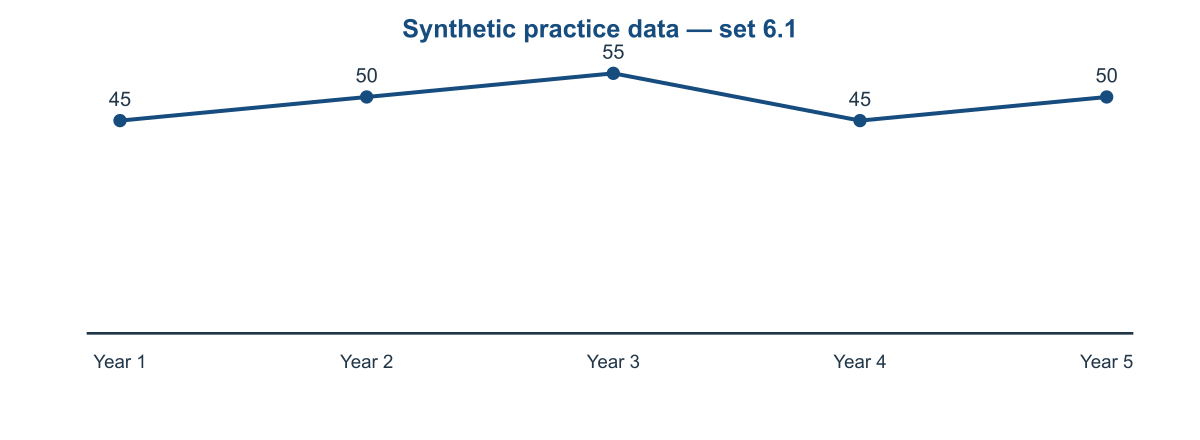
A. 5 B. 0 C. 15 D. 10
2. What is the combined value for Year 2 and Year 3?
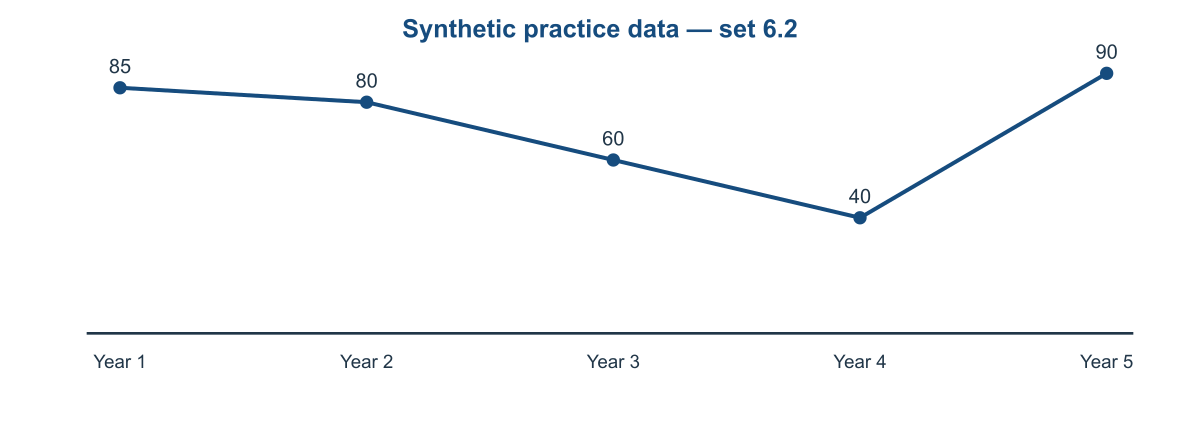
A. 140 B. 145 C. 135 D. 150
3. What is the peak labelled value across the five years?
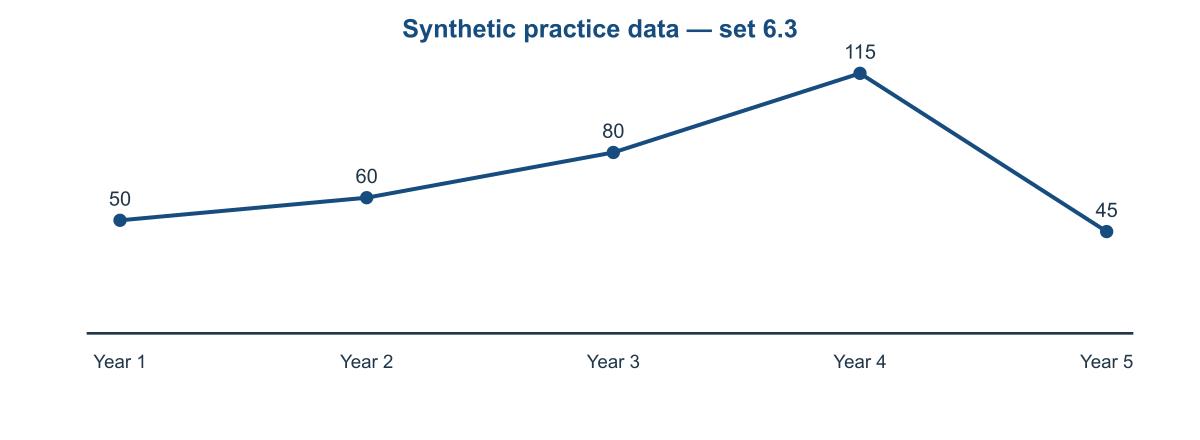
A. 125 B. 115 C. 110 D. 120
4. What is the lowest labelled value across the five years?
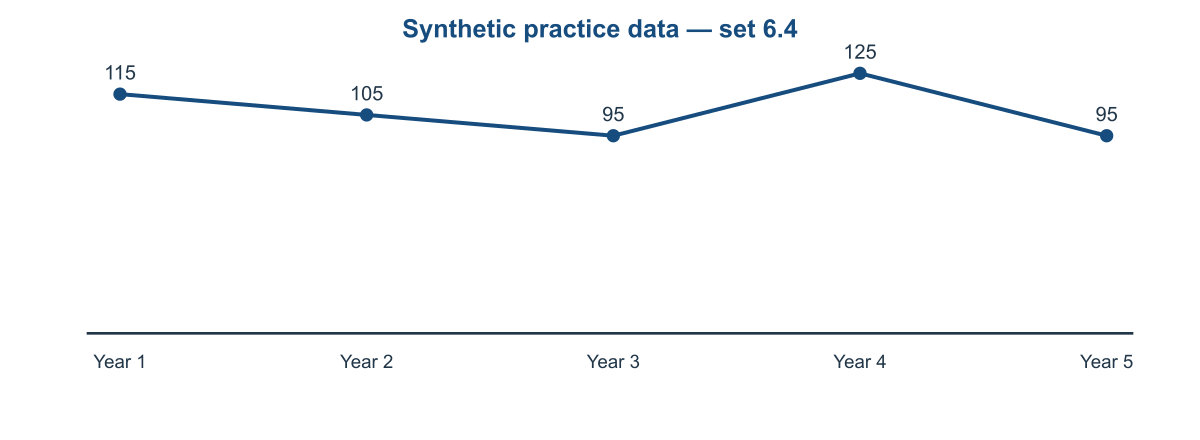
A. 95 B. 100 C. 105 D. 90
5. What is the five-year total?
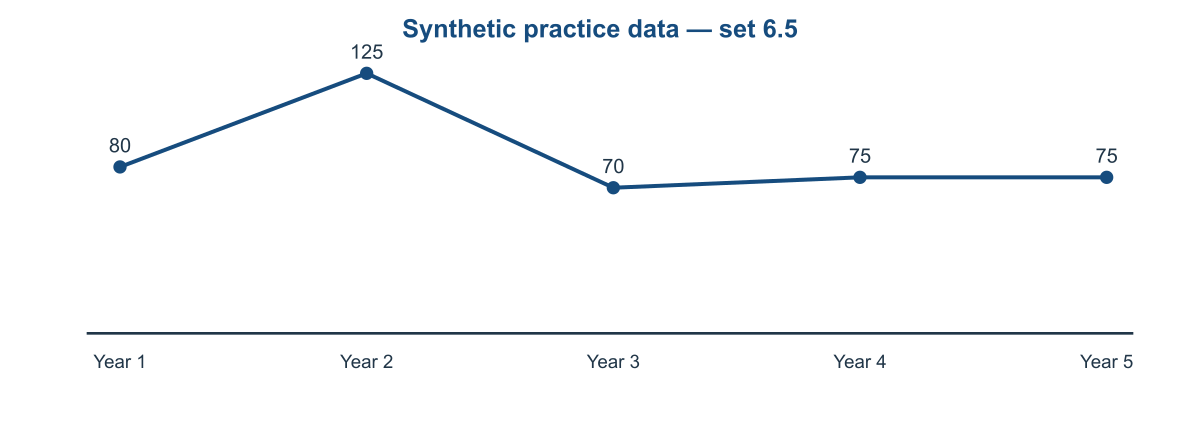
A. 425 B. 430 C. 435 D. 420
6. What is the absolute change from Year 1 to Year 5?
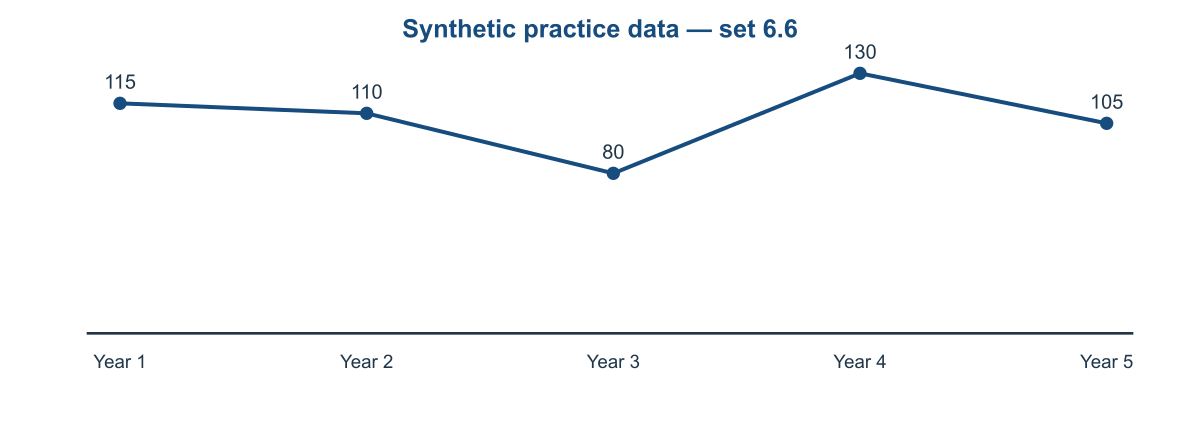
A. 15 B. 10 C. 5 D. 20
7. What is the combined value for Year 2 and Year 3?
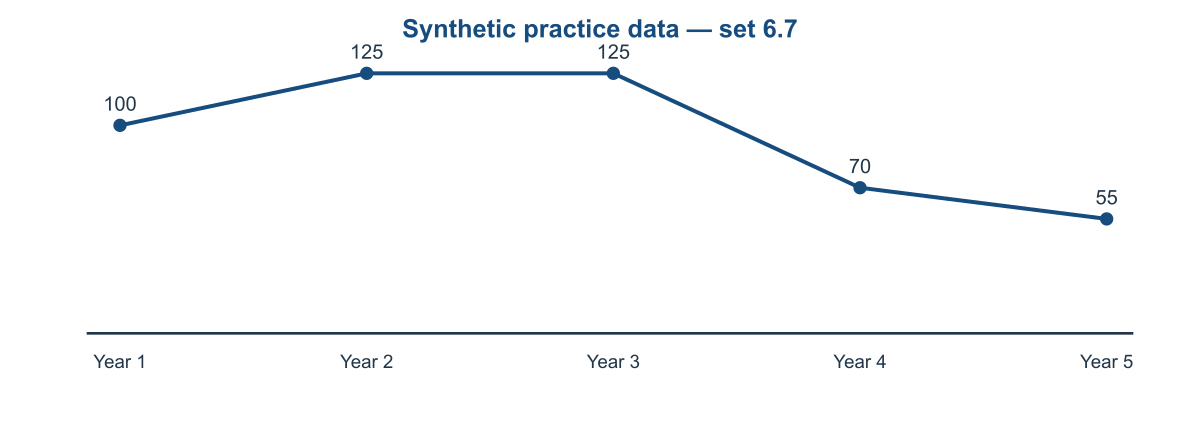
A. 250 B. 260 C. 255 D. 245
8. What is the peak labelled value across the five years?
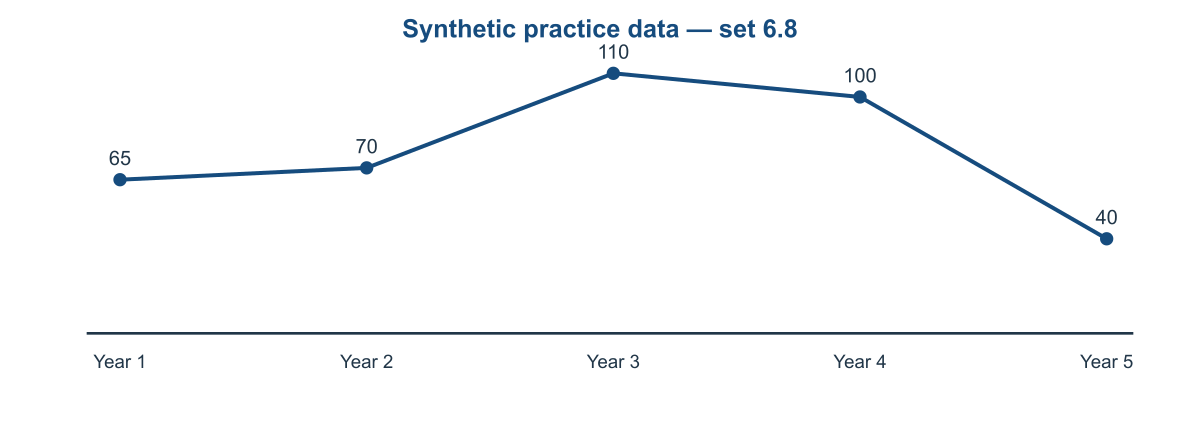
A. 110 B. 105 C. 120 D. 115
9. What is the lowest labelled value across the five years?
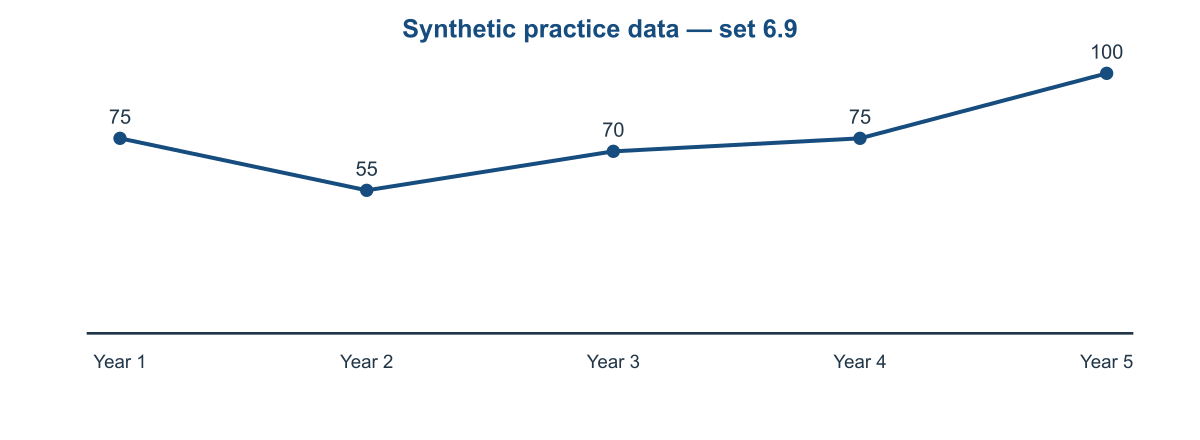
A. 65 B. 50 C. 60 D. 55
10. What is the five-year total?
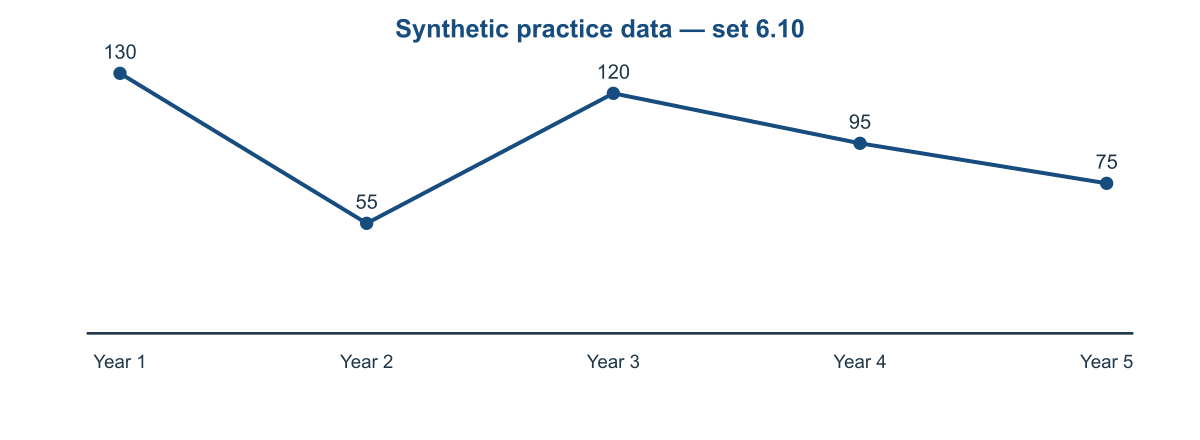
A. 480 B. 470 C. 485 D. 475
11. What is the absolute change from Year 1 to Year 5?
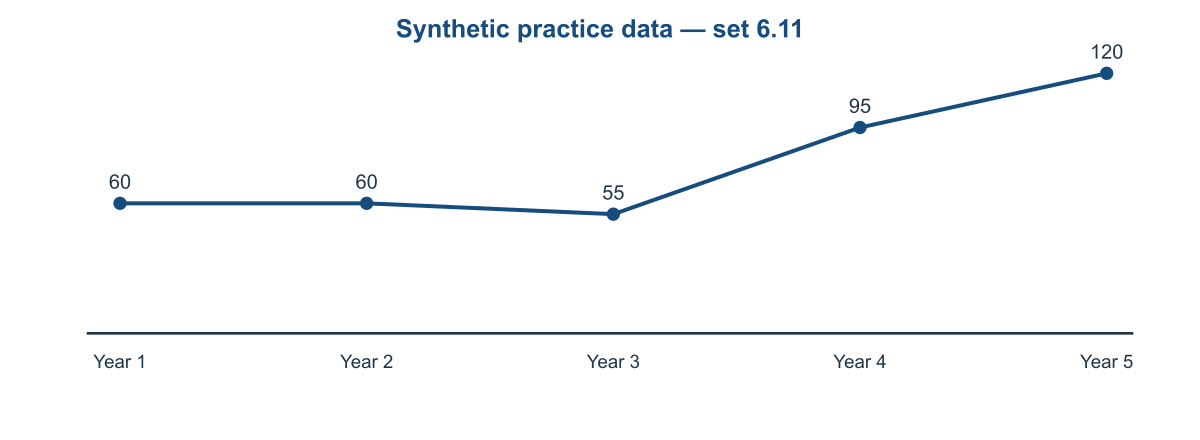
A. 55 B. 60 C. 65 D. 70
12. What is the combined value for Year 2 and Year 3?
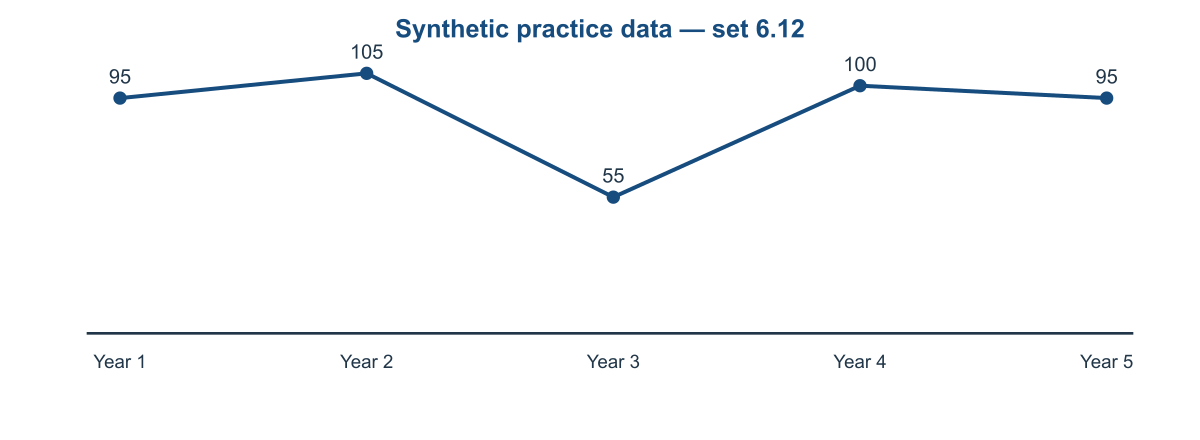
A. 170 B. 155 C. 165 D. 160
13. What is the peak labelled value across the five years?
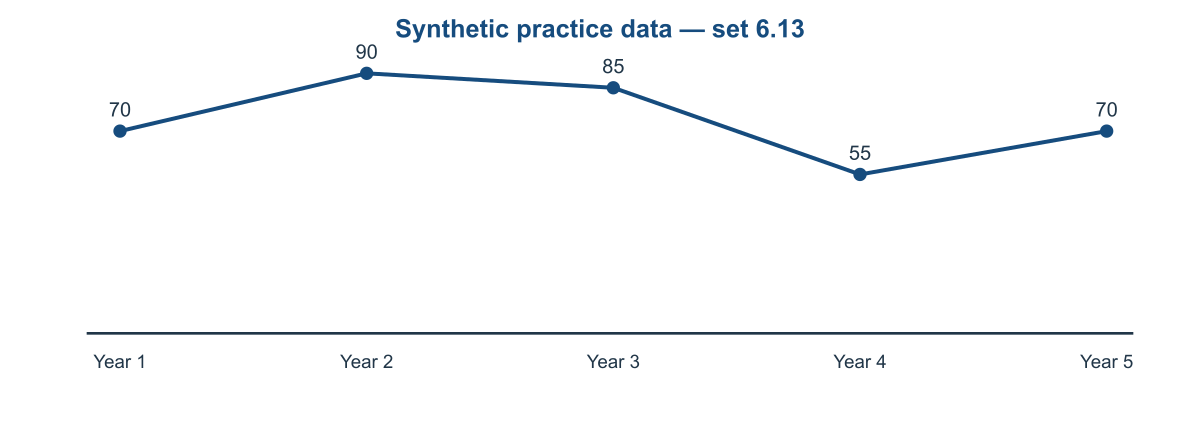
A. 95 B. 100 C. 90 D. 85
14. What is the lowest labelled value across the five years?
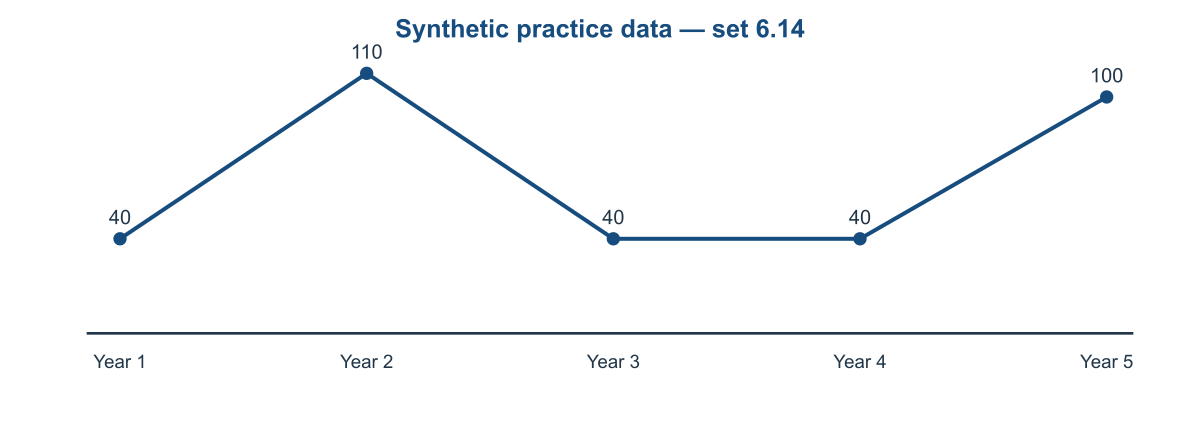
A. 35 B. 45 C. 50 D. 40
15. What is the five-year total?
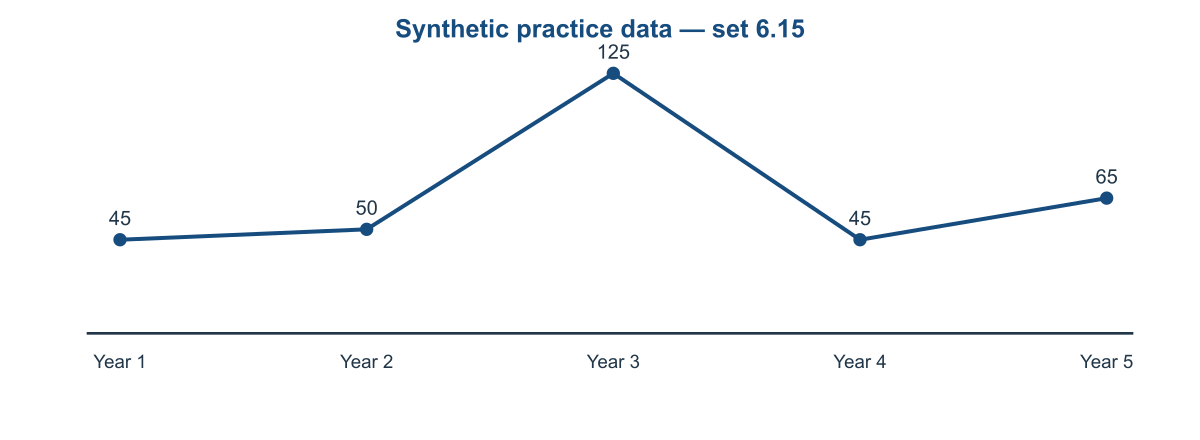
A. 340 B. 335 C. 330 D. 325
16. What is the absolute change from Year 1 to Year 5?
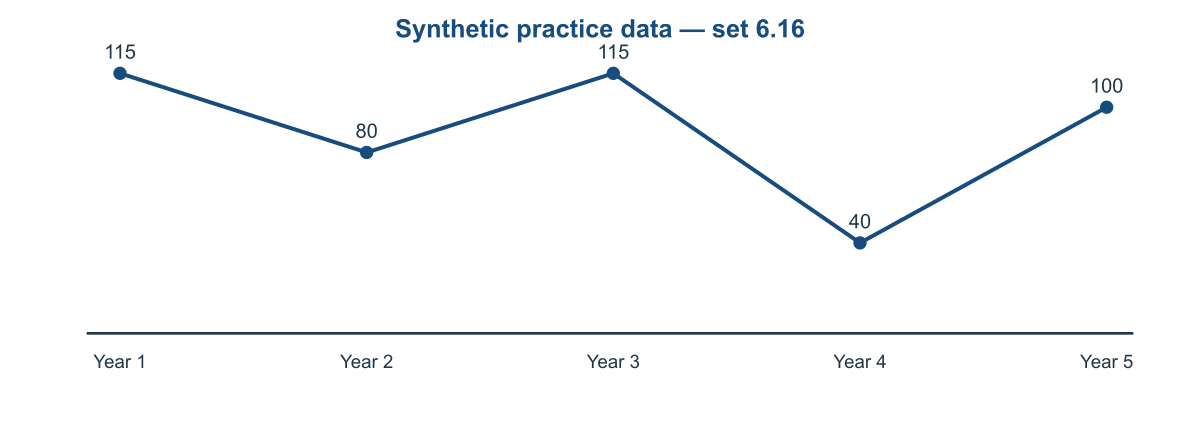
A. 20 B. 15 C. 25 D. 10
17. What is the combined value for Year 2 and Year 3?
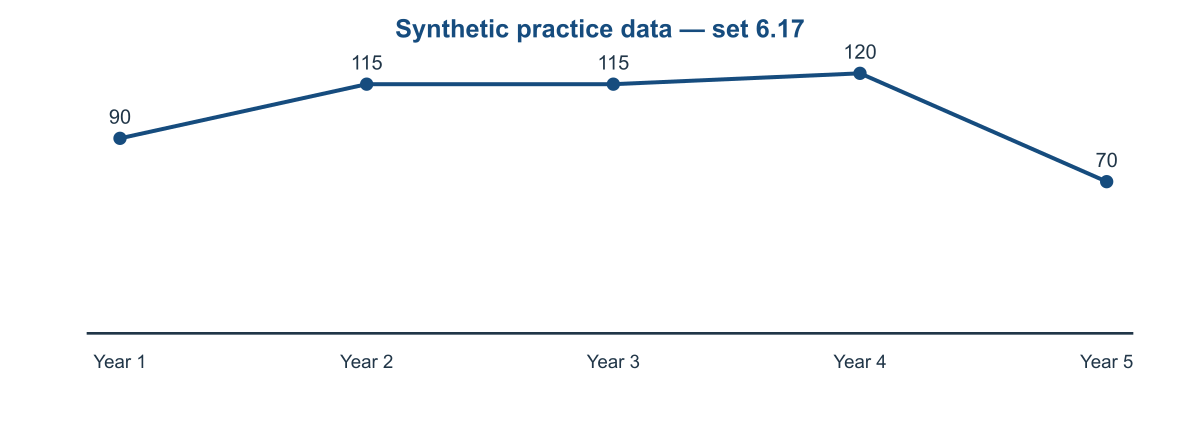
A. 235 B. 225 C. 230 D. 240
18. What is the peak labelled value across the five years?
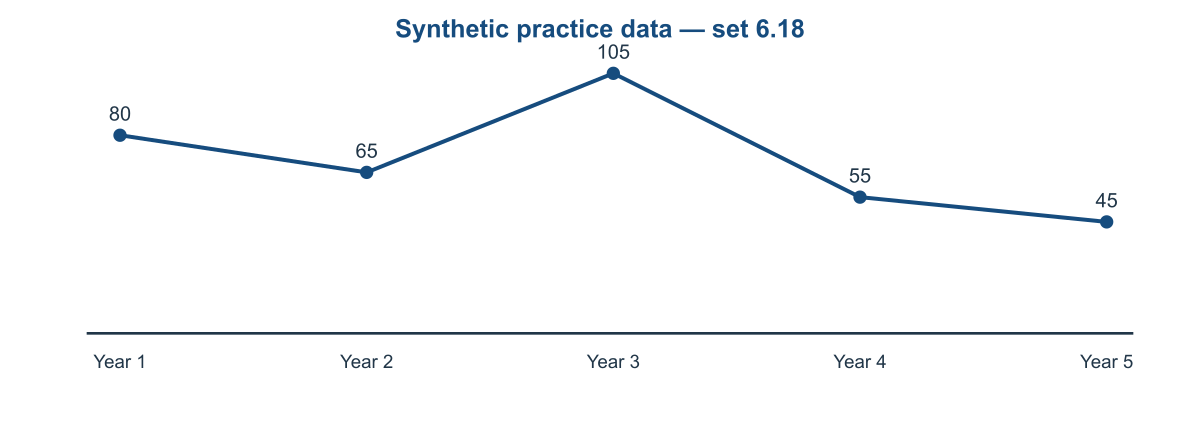
A. 110 B. 105 C. 115 D. 100
19. What is the lowest labelled value across the five years?
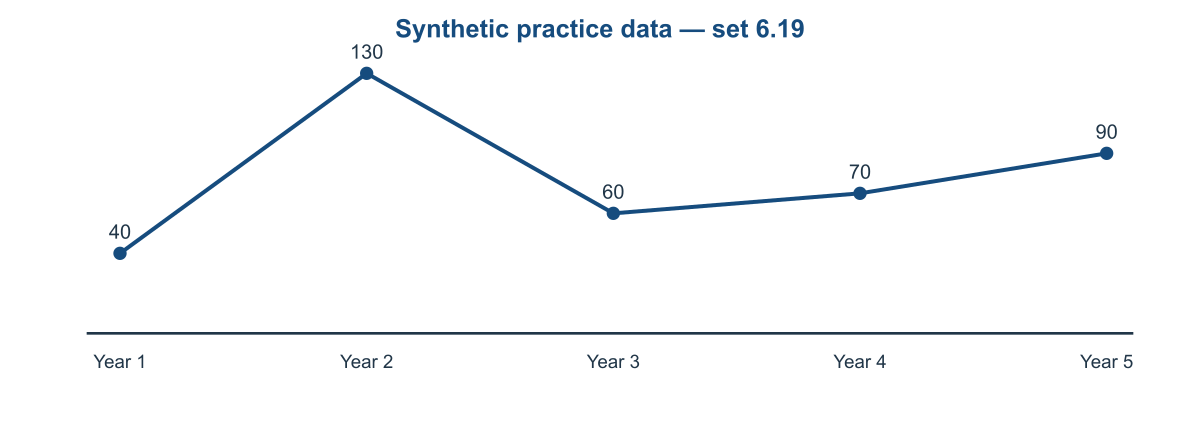
A. 35 B. 40 C. 45 D. 50
20. What is the five-year total?
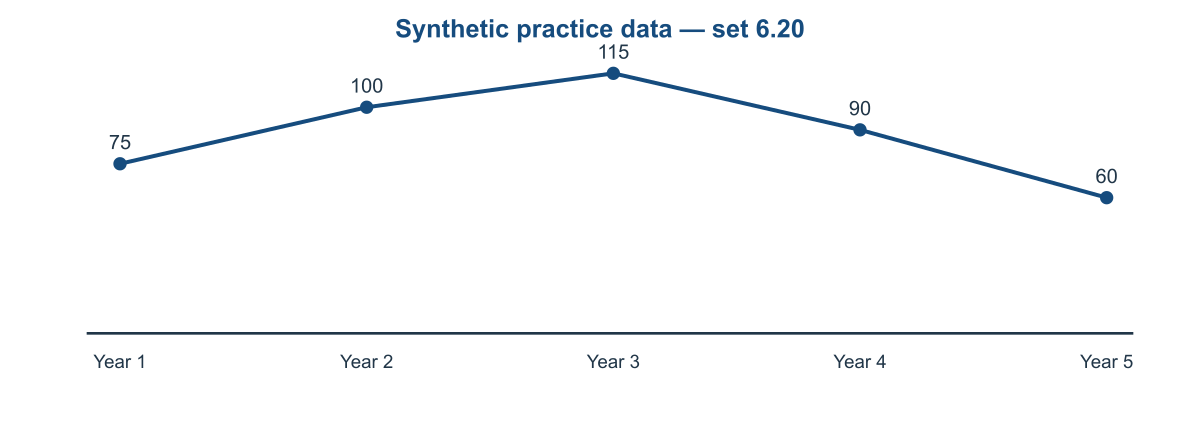
A. 440 B. 445 C. 450 D. 435
21. What is the absolute change from Year 1 to Year 5?
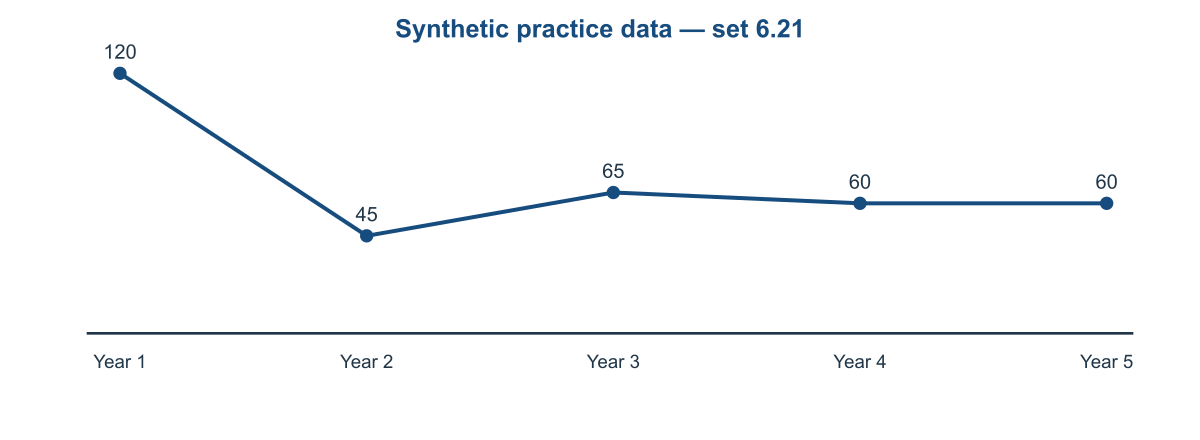
A. 70 B. 55 C. 60 D. 65
22. What is the combined value for Year 2 and Year 3?
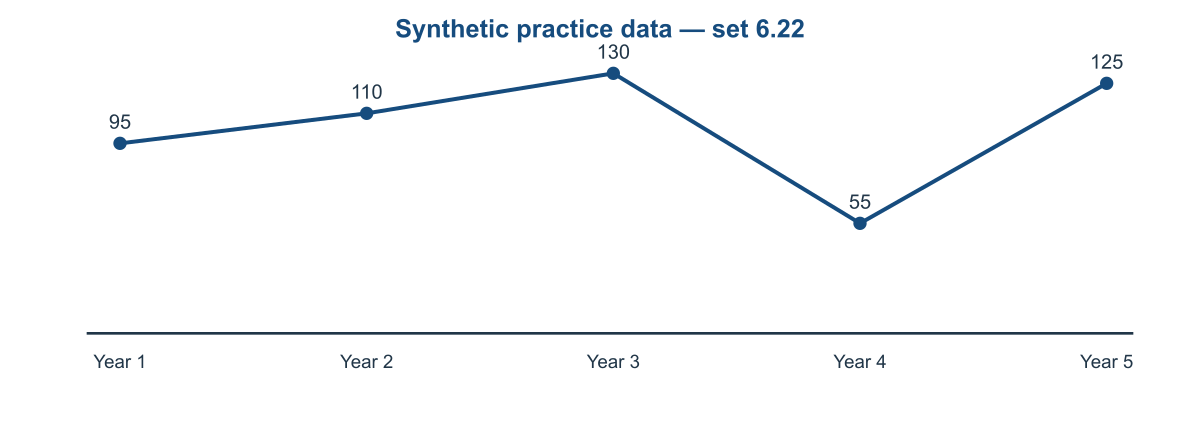
A. 235 B. 245 C. 250 D. 240
23. What is the peak labelled value across the five years?
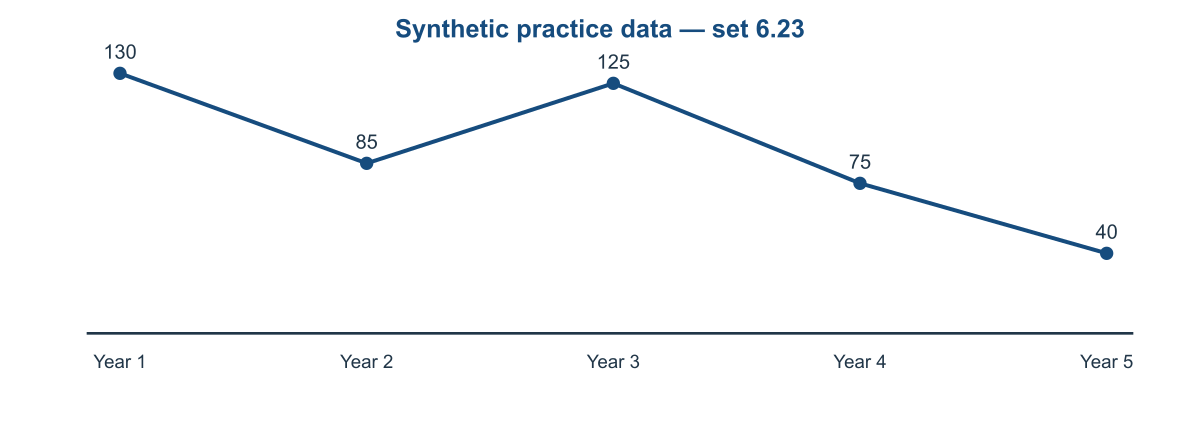
A. 125 B. 130 C. 135 D. 140
24. What is the lowest labelled value across the five years?
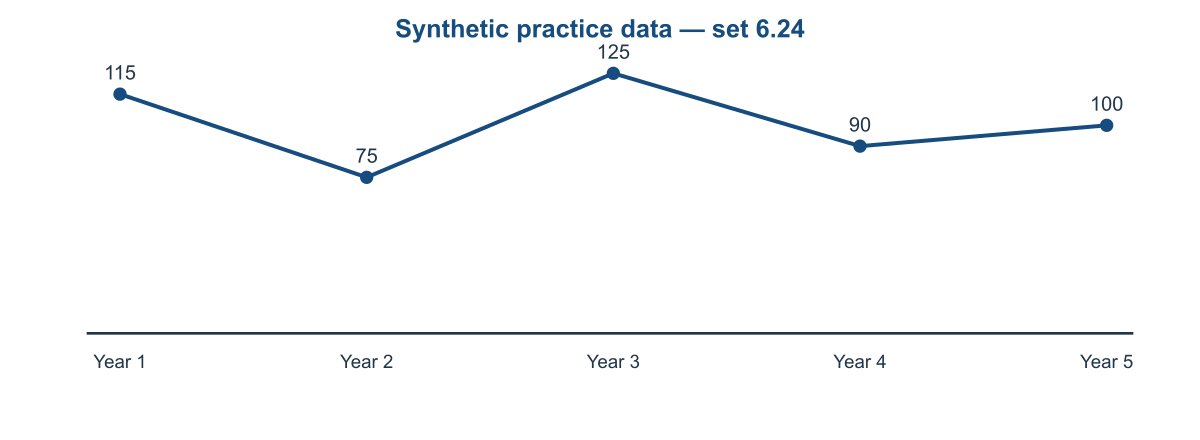
A. 80 B. 85 C. 75 D. 70
25. What is the five-year total?
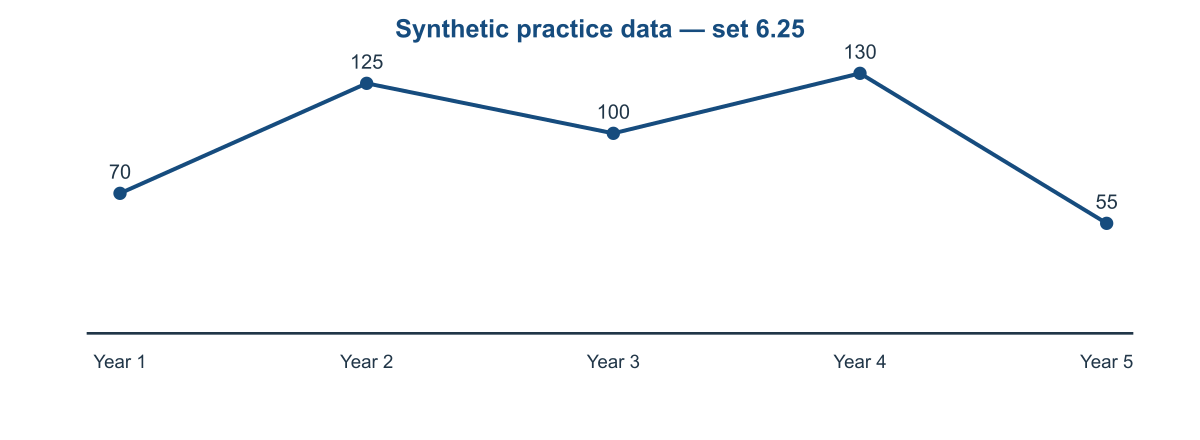
A. 485 B. 475 C. 490 D. 480
26. What is the absolute change from Year 1 to Year 5?
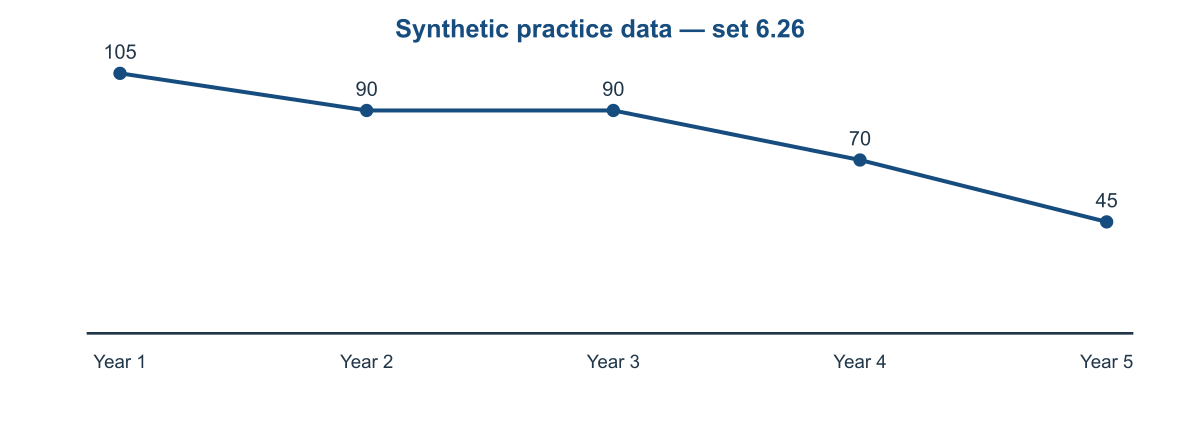
A. 55 B. 70 C. 65 D. 60
27. What is the combined value for Year 2 and Year 3?
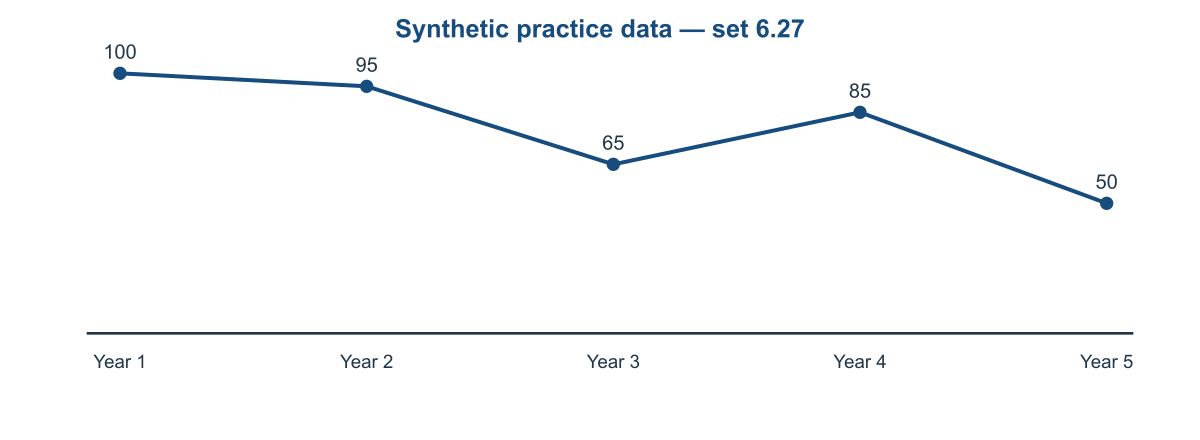
A. 165 B. 160 C. 155 D. 170
28. What is the peak labelled value across the five years?
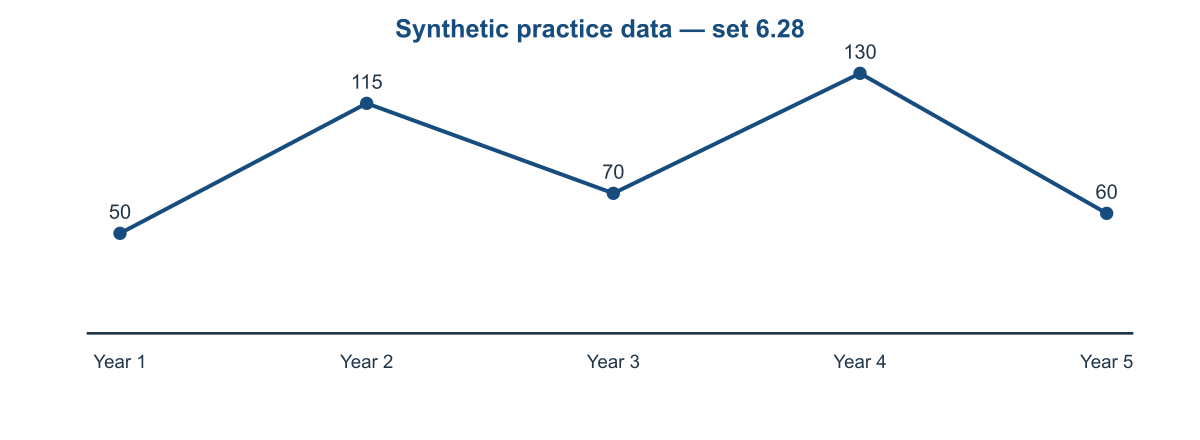
A. 140 B. 125 C. 135 D. 130
29. What is the lowest labelled value across the five years?
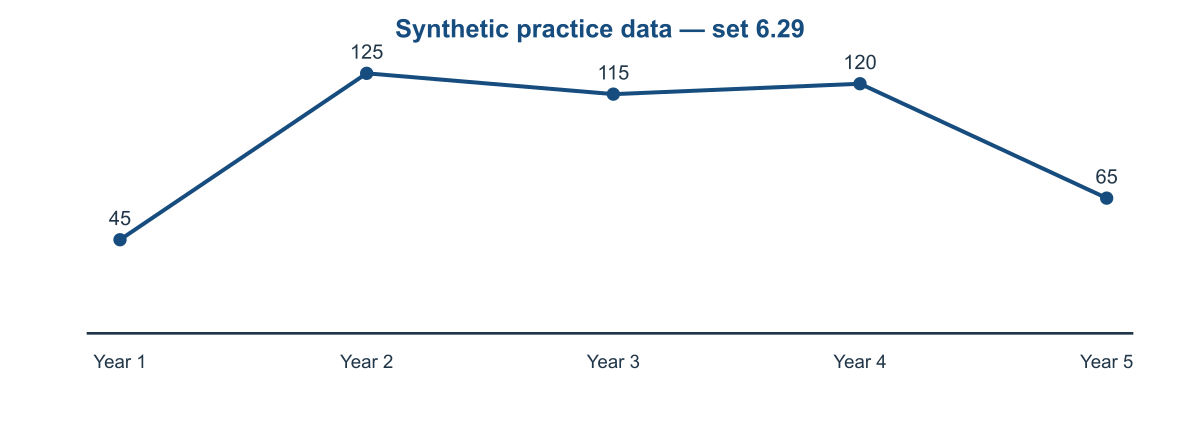
A. 40 B. 45 C. 50 D. 55
30. What is the five-year total?
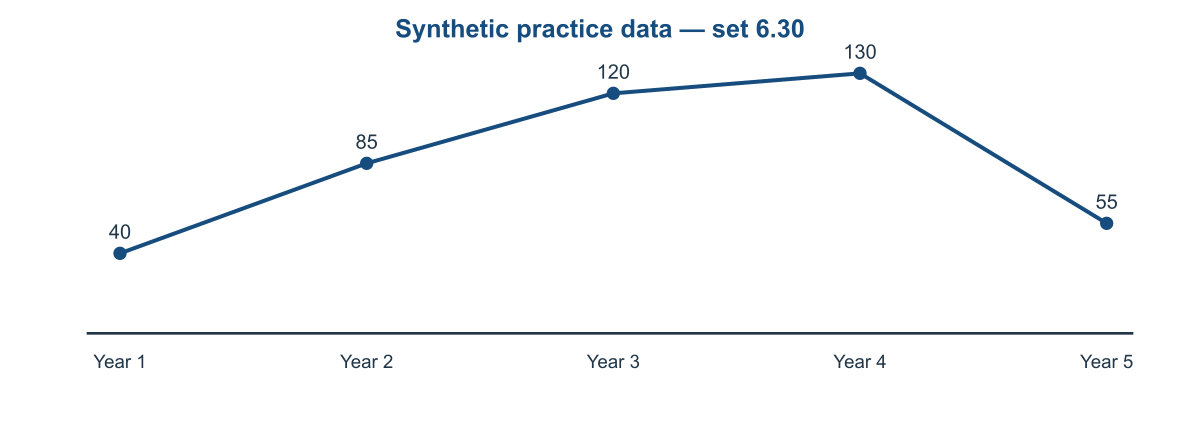
A. 430 B. 440 C. 425 D. 435
31. What is the absolute change from Year 1 to Year 5?
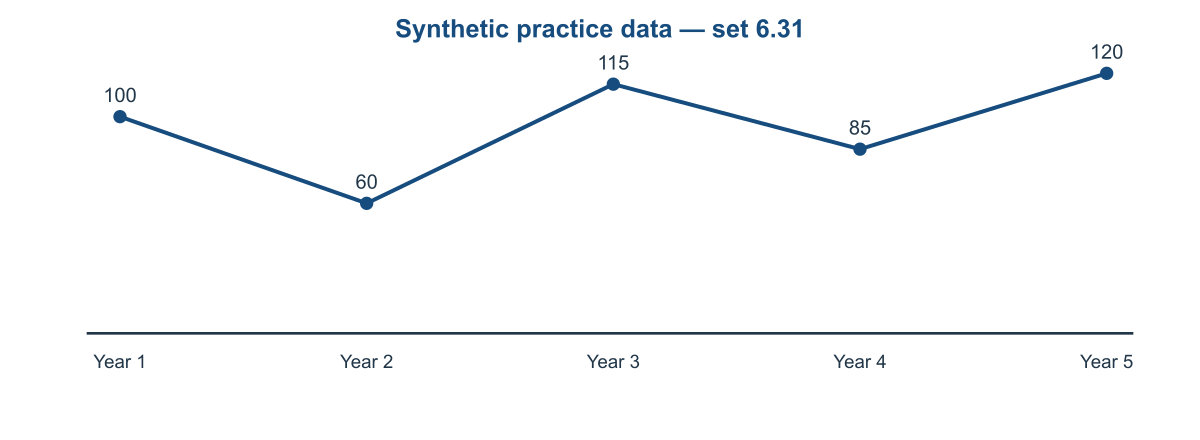
A. 30 B. 25 C. 20 D. 15
32. What is the combined value for Year 2 and Year 3?
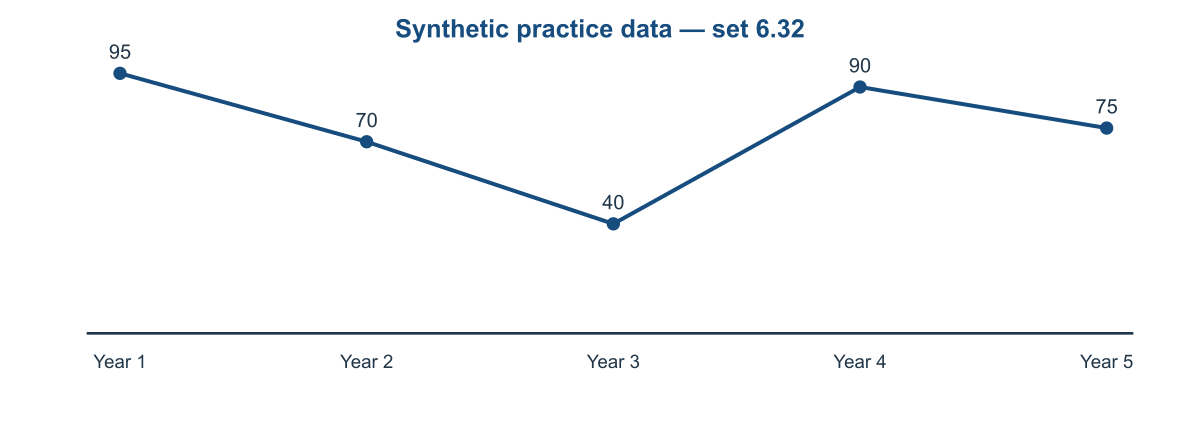
A. 110 B. 105 C. 115 D. 120
33. What is the peak labelled value across the five years?
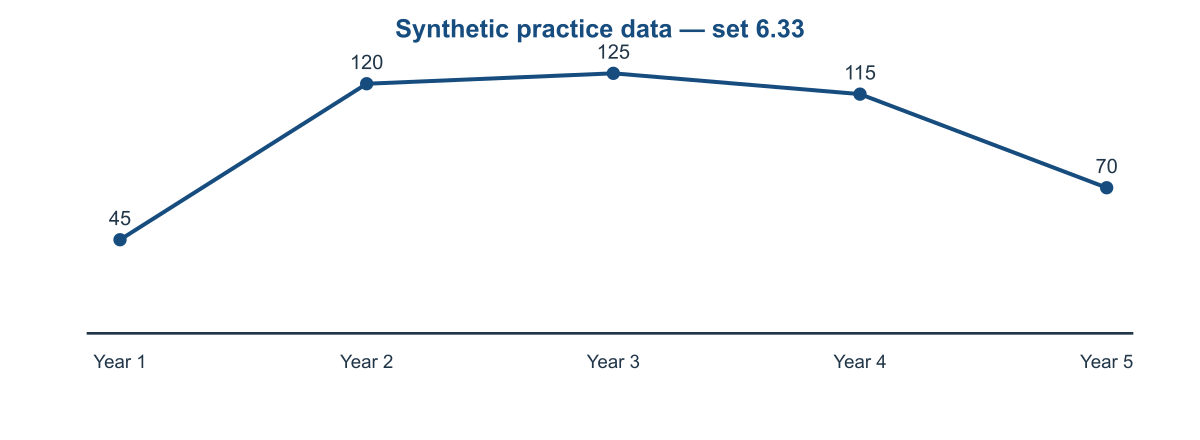
A. 125 B. 130 C. 135 D. 120
34. What is the lowest labelled value across the five years?
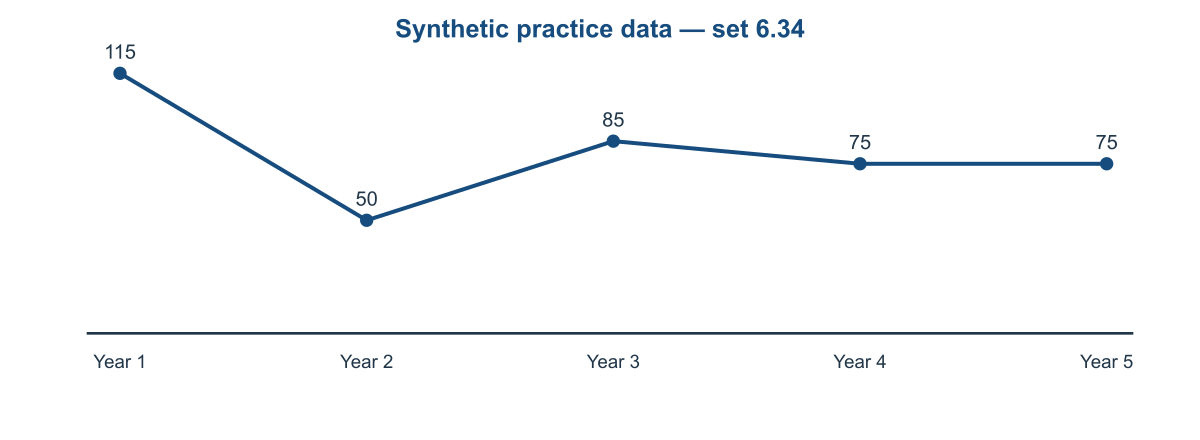
A. 45 B. 60 C. 50 D. 55
35. What is the five-year total?
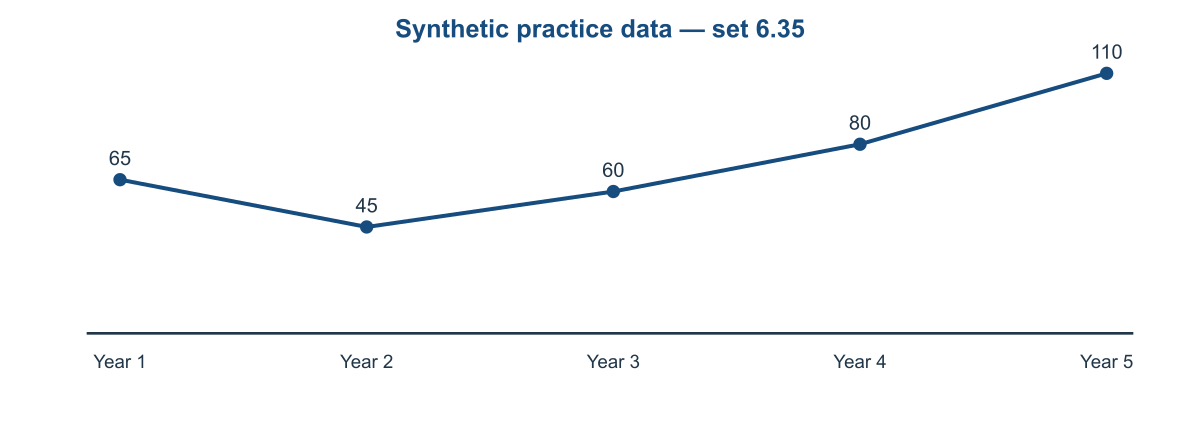
A. 365 B. 355 C. 360 D. 370
36. What is the absolute change from Year 1 to Year 5?
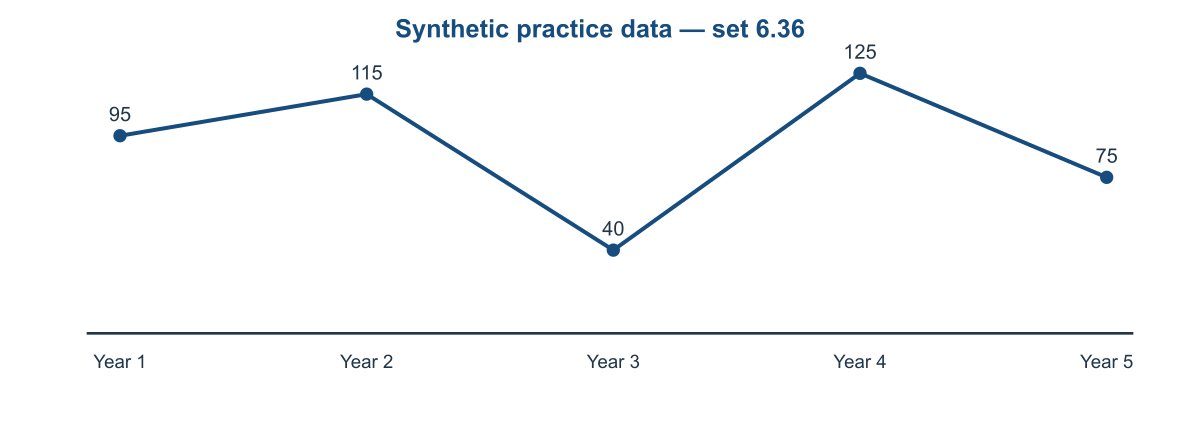
A. 20 B. 15 C. 25 D. 30
37. What is the combined value for Year 2 and Year 3?
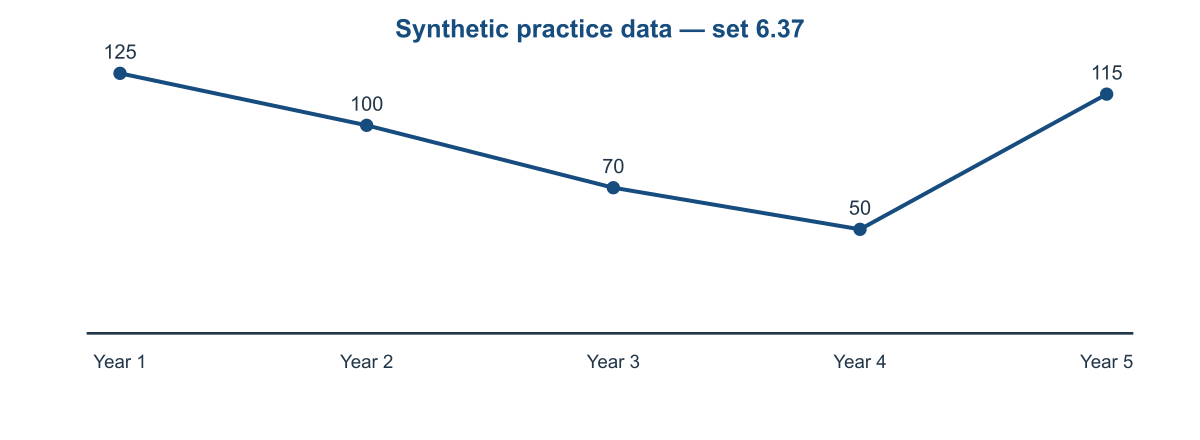
A. 165 B. 180 C. 175 D. 170
38. What is the peak labelled value across the five years?
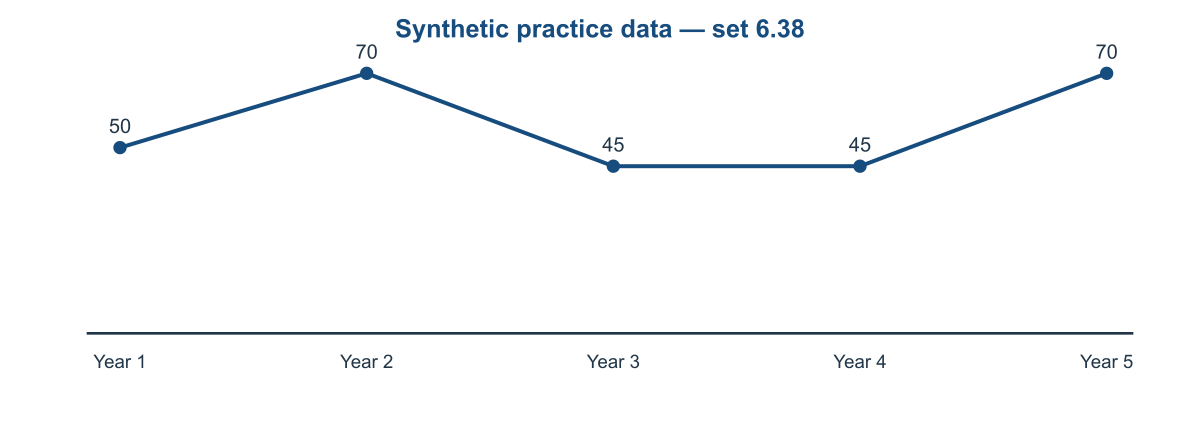
A. 80 B. 75 C. 70 D. 65
39. What is the lowest labelled value across the five years?
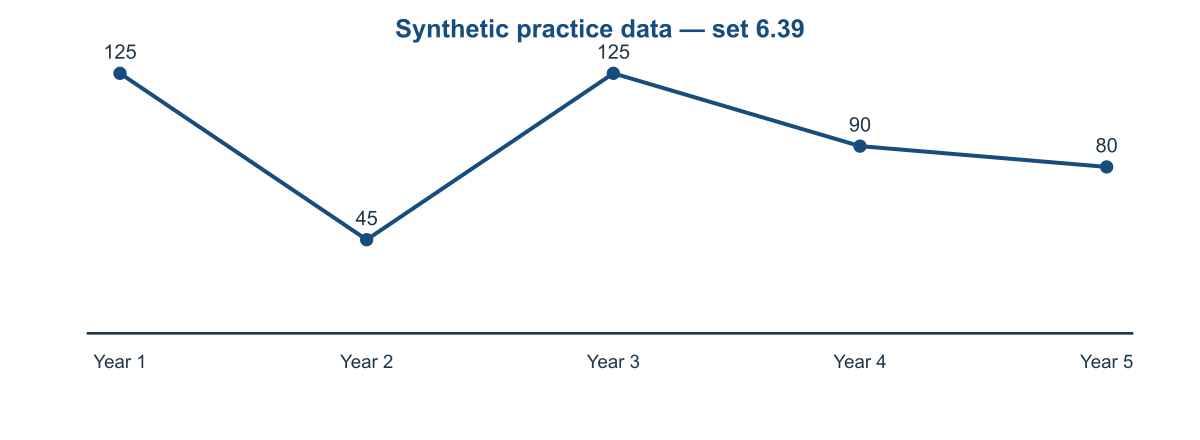
A. 40 B. 50 C. 55 D. 45
40. What is the five-year total?
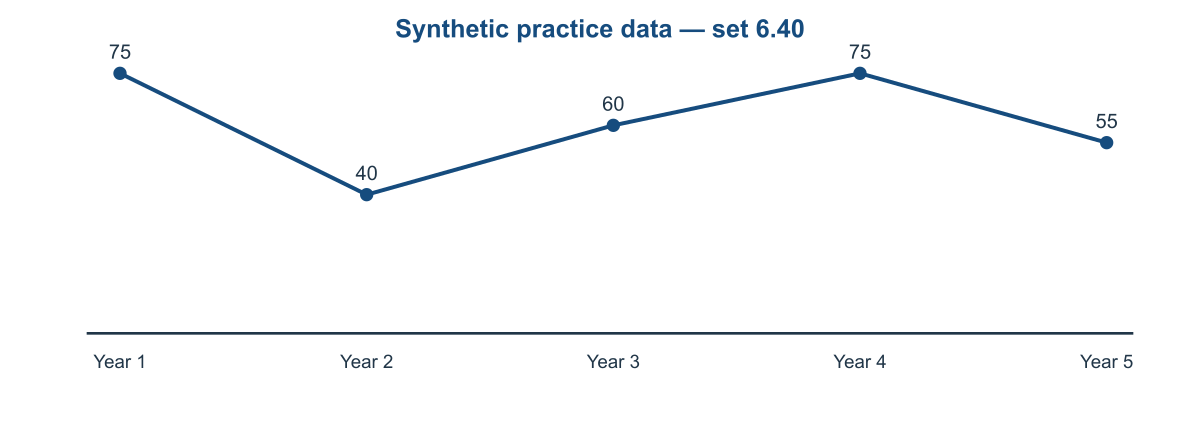
A. 315 B. 300 C. 310 D. 305
41. What is the absolute change from Year 1 to Year 5?
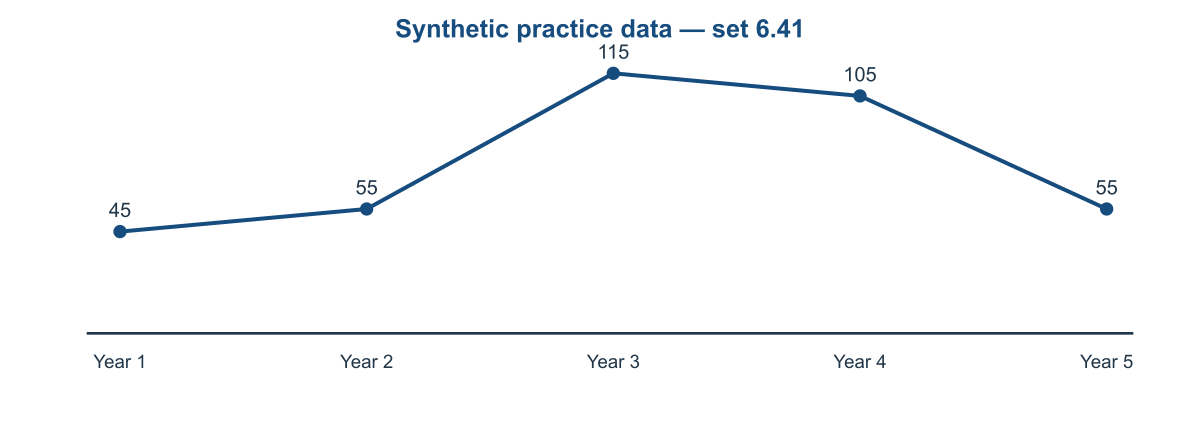
A. 10 B. 5 C. 15 D. 20
42. What is the combined value for Year 2 and Year 3?
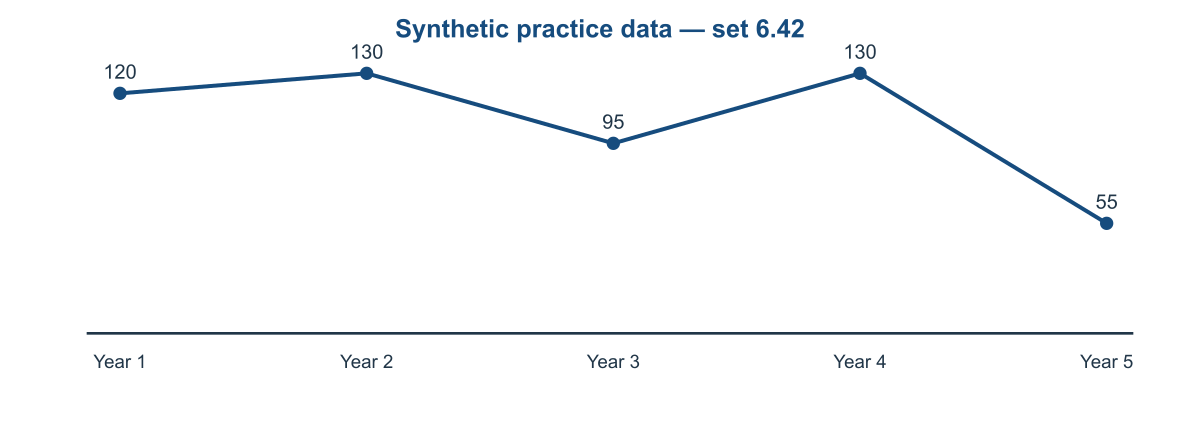
A. 235 B. 220 C. 230 D. 225
43. What is the peak labelled value across the five years?
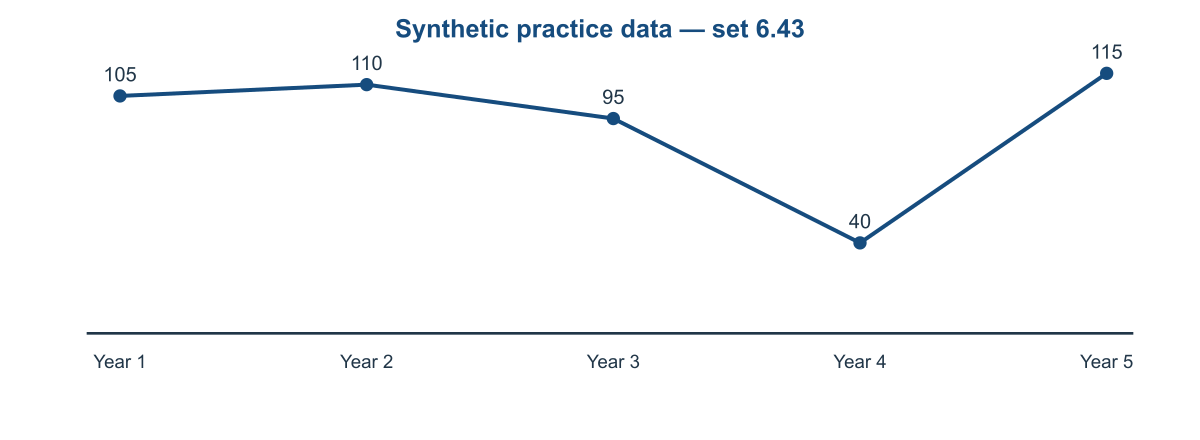
A. 115 B. 125 C. 120 D. 110
44. What is the lowest labelled value across the five years?
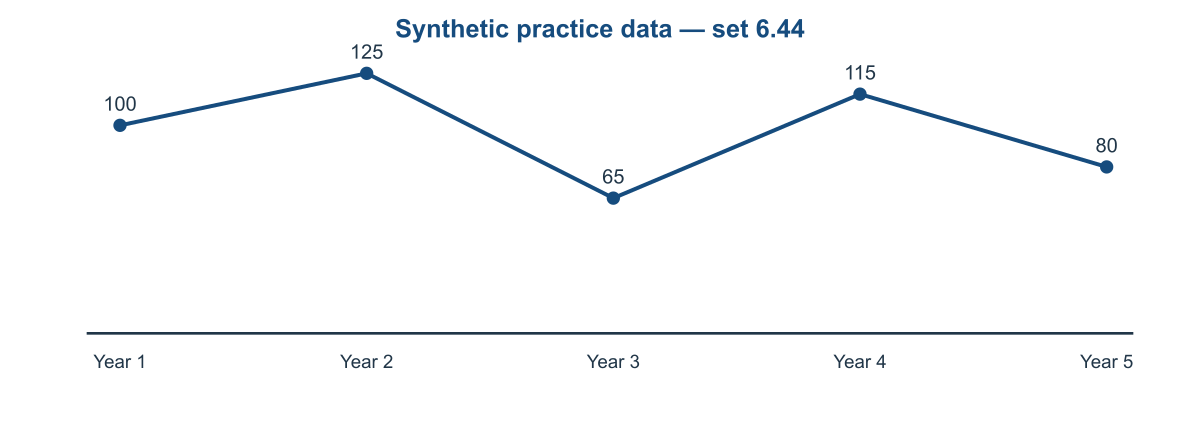
A. 70 B. 75 C. 60 D. 65
45. What is the five-year total?
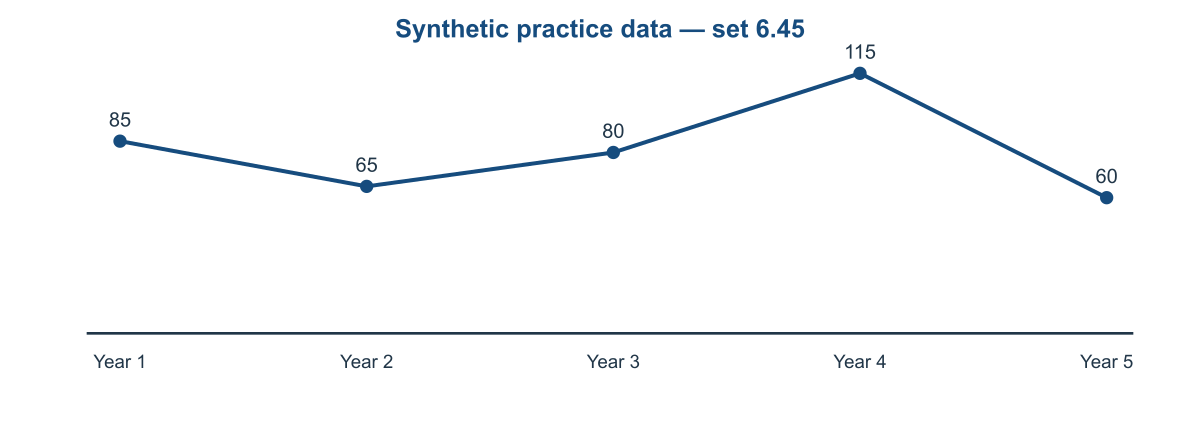
A. 410 B. 400 C. 415 D. 405
46. What is the absolute change from Year 1 to Year 5?
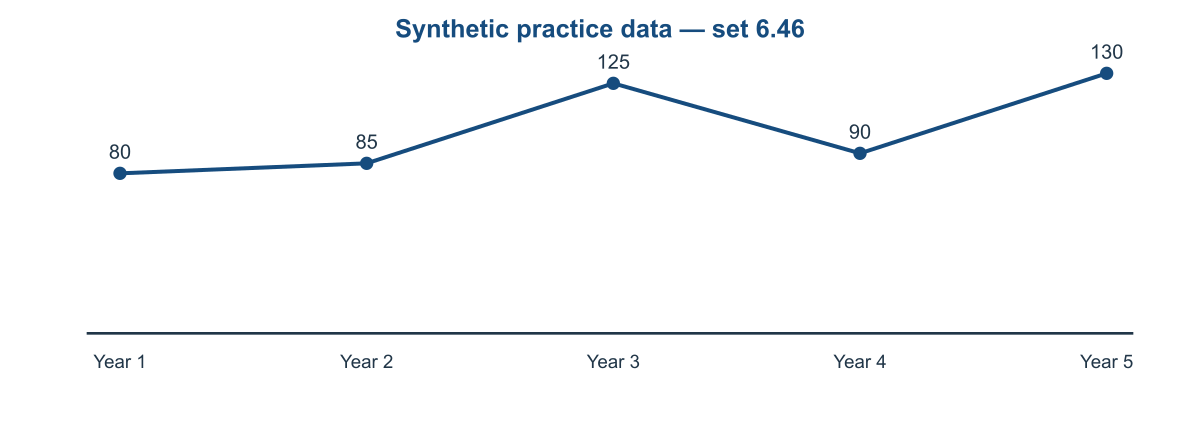
A. 45 B. 50 C. 55 D. 60
47. What is the combined value for Year 2 and Year 3?
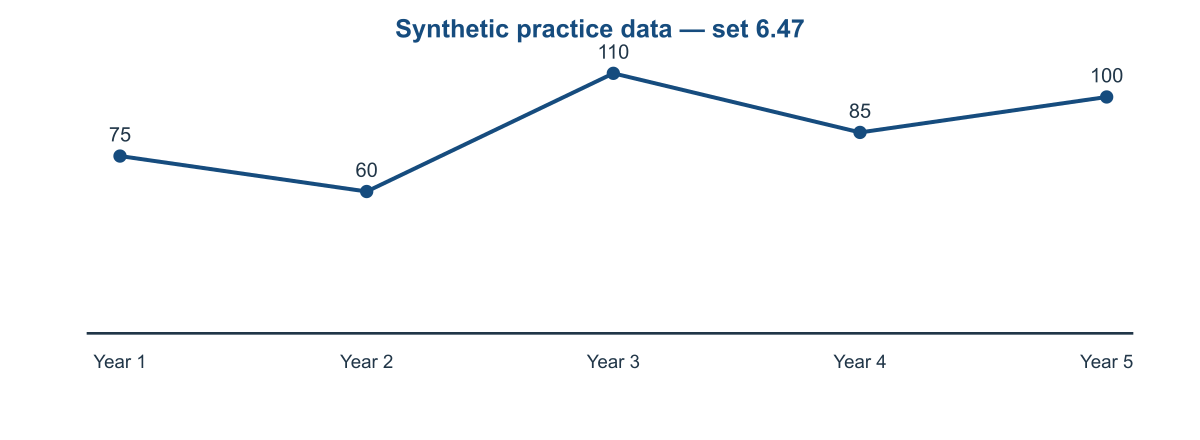
A. 180 B. 175 C. 165 D. 170
48. What is the peak labelled value across the five years?
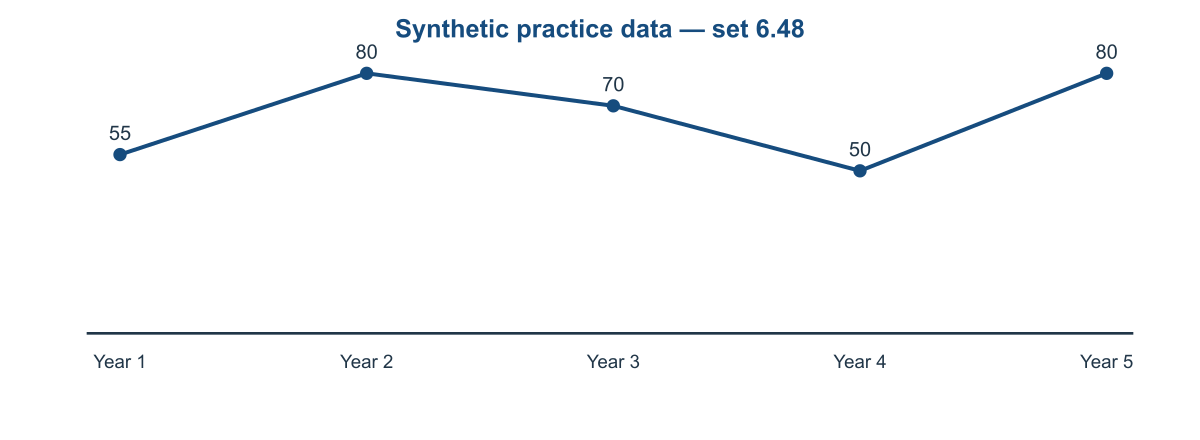
A. 85 B. 75 C. 80 D. 90
49. What is the lowest labelled value across the five years?
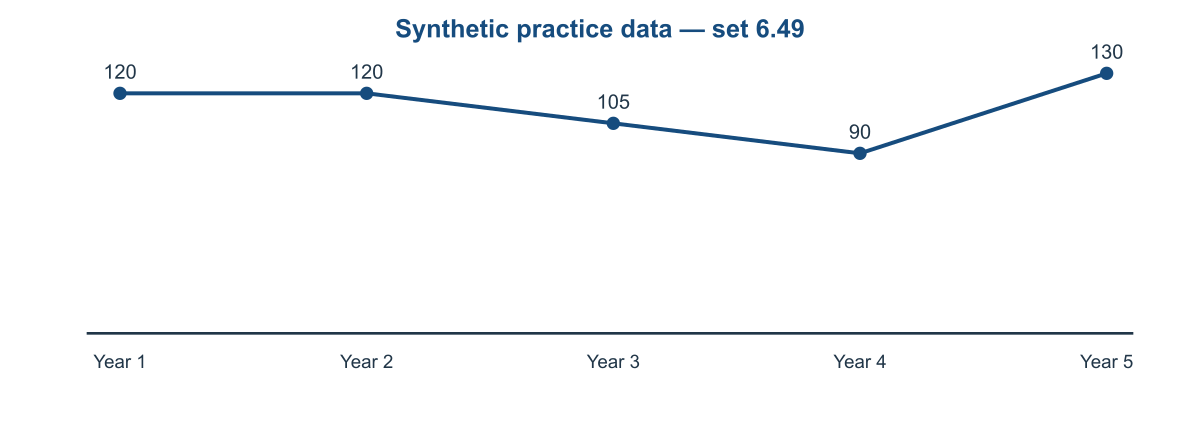
A. 90 B. 100 C. 95 D. 85
50. What is the five-year total?
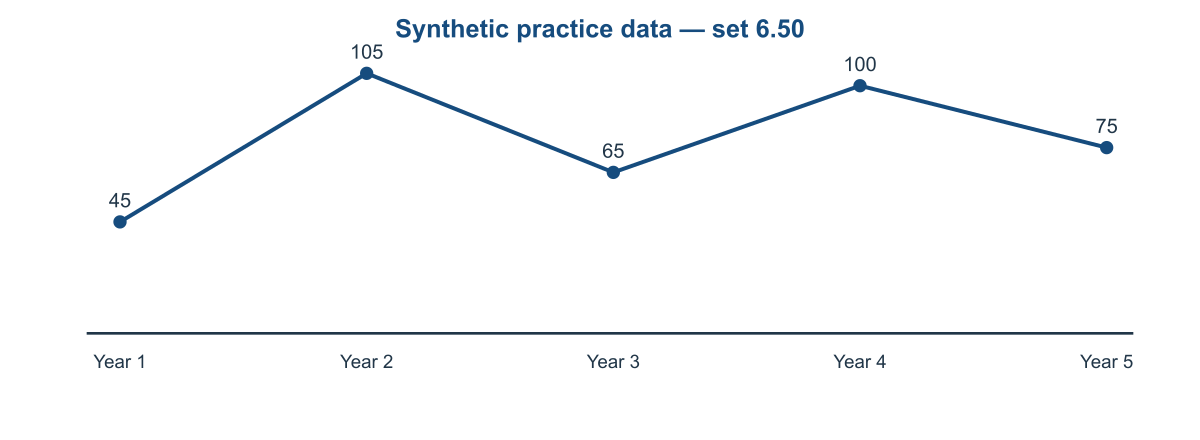
A. 400 B. 390 C. 385 D. 395
Answers and explanations
Check the value and the unit before comparing your working with the calculation.
1. A. Use Year 1=45 and Year 5=50; absolute change |50−45|=5.
APDI26-06-01 | line-charts | Easy
2. A. Year 2=80 and Year 3=60; total 140.
APDI26-06-02 | line-charts | Easy
3. B. Compare [50, 60, 80, 115, 45]; the peak is 115.
APDI26-06-03 | line-charts | Easy
4. A. Compare [115, 105, 95, 125, 95]; the minimum is 95.
APDI26-06-04 | line-charts | Easy
5. A. Add the five point labels [80, 125, 70, 75, 75]; total 425.
APDI26-06-05 | line-charts | Easy
6. B. Use Year 1=115 and Year 5=105; absolute change |105−115|=10.
APDI26-06-06 | line-charts | Easy
7. A. Year 2=125 and Year 3=125; total 250.
APDI26-06-07 | line-charts | Easy
8. A. Compare [65, 70, 110, 100, 40]; the peak is 110.
APDI26-06-08 | line-charts | Easy
9. D. Compare [75, 55, 70, 75, 100]; the minimum is 55.
APDI26-06-09 | line-charts | Easy
10. D. Add the five point labels [130, 55, 120, 95, 75]; total 475.
APDI26-06-10 | line-charts | Easy
11. B. Use Year 1=60 and Year 5=120; absolute change |120−60|=60.
APDI26-06-11 | line-charts | Easy
12. D. Year 2=105 and Year 3=55; total 160.
APDI26-06-12 | line-charts | Easy
13. C. Compare [70, 90, 85, 55, 70]; the peak is 90.
APDI26-06-13 | line-charts | Easy
14. D. Compare [40, 110, 40, 40, 100]; the minimum is 40.
APDI26-06-14 | line-charts | Easy
15. C. Add the five point labels [45, 50, 125, 45, 65]; total 330.
APDI26-06-15 | line-charts | Easy
16. B. Use Year 1=115 and Year 5=100; absolute change |100−115|=15.
APDI26-06-16 | line-charts | Medium
17. C. Year 2=115 and Year 3=115; total 230.
APDI26-06-17 | line-charts | Medium
18. B. Compare [80, 65, 105, 55, 45]; the peak is 105.
APDI26-06-18 | line-charts | Medium
19. B. Compare [40, 130, 60, 70, 90]; the minimum is 40.
APDI26-06-19 | line-charts | Medium
20. A. Add the five point labels [75, 100, 115, 90, 60]; total 440.
APDI26-06-20 | line-charts | Medium
21. C. Use Year 1=120 and Year 5=60; absolute change |60−120|=60.
APDI26-06-21 | line-charts | Medium
22. D. Year 2=110 and Year 3=130; total 240.
APDI26-06-22 | line-charts | Medium
23. B. Compare [130, 85, 125, 75, 40]; the peak is 130.
APDI26-06-23 | line-charts | Medium
24. C. Compare [115, 75, 125, 90, 100]; the minimum is 75.
APDI26-06-24 | line-charts | Medium
25. D. Add the five point labels [70, 125, 100, 130, 55]; total 480.
APDI26-06-25 | line-charts | Medium
26. D. Use Year 1=105 and Year 5=45; absolute change |45−105|=60.
APDI26-06-26 | line-charts | Medium
27. B. Year 2=95 and Year 3=65; total 160.
APDI26-06-27 | line-charts | Medium
28. D. Compare [50, 115, 70, 130, 60]; the peak is 130.
APDI26-06-28 | line-charts | Medium
29. B. Compare [45, 125, 115, 120, 65]; the minimum is 45.
APDI26-06-29 | line-charts | Medium
30. A. Add the five point labels [40, 85, 120, 130, 55]; total 430.
APDI26-06-30 | line-charts | Medium
31. C. Use Year 1=100 and Year 5=120; absolute change |120−100|=20.
APDI26-06-31 | line-charts | Medium
32. A. Year 2=70 and Year 3=40; total 110.
APDI26-06-32 | line-charts | Medium
33. A. Compare [45, 120, 125, 115, 70]; the peak is 125.
APDI26-06-33 | line-charts | Medium
34. C. Compare [115, 50, 85, 75, 75]; the minimum is 50.
APDI26-06-34 | line-charts | Medium
35. C. Add the five point labels [65, 45, 60, 80, 110]; total 360.
APDI26-06-35 | line-charts | Medium
36. A. Use Year 1=95 and Year 5=75; absolute change |75−95|=20.
APDI26-06-36 | line-charts | Medium
37. D. Year 2=100 and Year 3=70; total 170.
APDI26-06-37 | line-charts | Medium
38. C. Compare [50, 70, 45, 45, 70]; the peak is 70.
APDI26-06-38 | line-charts | Medium
39. D. Compare [125, 45, 125, 90, 80]; the minimum is 45.
APDI26-06-39 | line-charts | Medium
40. D. Add the five point labels [75, 40, 60, 75, 55]; total 305.
APDI26-06-40 | line-charts | Medium
41. A. Use Year 1=45 and Year 5=55; absolute change |55−45|=10.
APDI26-06-41 | line-charts | Difficult
42. D. Year 2=130 and Year 3=95; total 225.
APDI26-06-42 | line-charts | Difficult
43. A. Compare [105, 110, 95, 40, 115]; the peak is 115.
APDI26-06-43 | line-charts | Difficult
44. D. Compare [100, 125, 65, 115, 80]; the minimum is 65.
APDI26-06-44 | line-charts | Difficult
45. D. Add the five point labels [85, 65, 80, 115, 60]; total 405.
APDI26-06-45 | line-charts | Difficult
46. B. Use Year 1=80 and Year 5=130; absolute change |130−80|=50.
APDI26-06-46 | line-charts | Difficult
47. D. Year 2=60 and Year 3=110; total 170.
APDI26-06-47 | line-charts | Difficult
48. C. Compare [55, 80, 70, 50, 80]; the peak is 80.
APDI26-06-48 | line-charts | Difficult
49. A. Compare [120, 120, 105, 90, 130]; the minimum is 90.
APDI26-06-49 | line-charts | Difficult
50. B. Add the five point labels [45, 105, 65, 100, 75]; total 390.
APDI26-06-50 | line-charts | Difficult