Bars encode category values
In a bar chart, the bar height or length represents the value, subject to the axis scale. Read the label and tick marks; do not assume each grid interval is 10. In grouped bars, first identify the colour or pattern for each series, then match the category. In a stacked bar, the full height is the total, while an individual segment is one component. If two segments are 40 and 60, the whole bar is 100; the second segment's share is 60%, not 60/40.
Histogram bins are intervals
A histogram groups observations into intervals. The height normally records frequency for equal-width bins. If widths differ, frequency density may be needed, so read the axis description carefully. The left edge of a bar is not the observed value; a bin from 20 to under 30 contains a range of observations. To estimate an average from grouped data, multiply each bin midpoint by its frequency and divide by the total frequency. Label this an estimate because the exact positions within bins are unknown.
Compare responsibly
For percentage change between two bar values, use the first value as base. A fall from 80 to 60 is 20/80=25%; a rise from 60 to 80 is 20/60≈33.3%. The percentages differ although the unit difference is the same. When bars use a truncated axis, trust printed numbers or the ticks rather than apparent length alone. Check whether the question asks a segment, a total, a difference or a ratio before taking values from the chart.
A bar chart has categories; a histogram has intervals
Suppose blue and teal bars show Unit C at 75 and 90. The teal series exceeds the blue by 15; its percentage excess relative to blue is 15/75=20%. If asked for their combined count, add 75+90=165. The colours represent different series at the same category. Reading a blue bar at Unit D instead of Unit C is a category error, while reading teal instead of blue is a legend error. Check both coordinates before arithmetic.
Now consider equal-width histogram intervals 0–<10, 10–<20, 20–<30, 30–<40 and 40–<50 with frequencies 8, 12, 15, 10 and 5. The total number of observations is 50. The modal interval is 20–<30 because its frequency 15 is highest. There are 8+12=20 observations below 20, and 10+5=15 observations in intervals beginning at 30. The bar labelled 20–<30 does not tell us that the observations all equal 25; it tells us only the interval and its count.
Frequency and the bin boundary
The notation 20–<30 means values at least 20 and less than 30. A value of exactly 30 belongs in the next interval, 30–<40. If the bins are all width 10, their labelled heights are directly comparable as frequencies. If one bin is twice as wide as another, the picture needs a frequency-density scale to make bar area represent frequency. The practice histograms use equal-width intervals and print the frequency above every bar, so calculate from those exact labels.
When estimation is allowed
For grouped data, a midpoint estimate of the mean uses the midpoint of each interval: 5, 15, 25, 35 and 45 for the example above. The weighted sum is 8×5+12×15+15×25+10×35+5×45=1170; divide by 50 for an estimated mean of 23.4. This is not an exact mean because the individual observations are hidden. State “estimated” whenever midpoint reasoning is used. The chapter MCQs ask exact questions that can be answered from the displayed frequencies; do not invent individual values from a histogram.
Practice — 50 questions
Attempt every item before reading the answers. Use the chart or caselet printed with the question.
1. What is the combined count for Unit A and Unit B in the blue series?
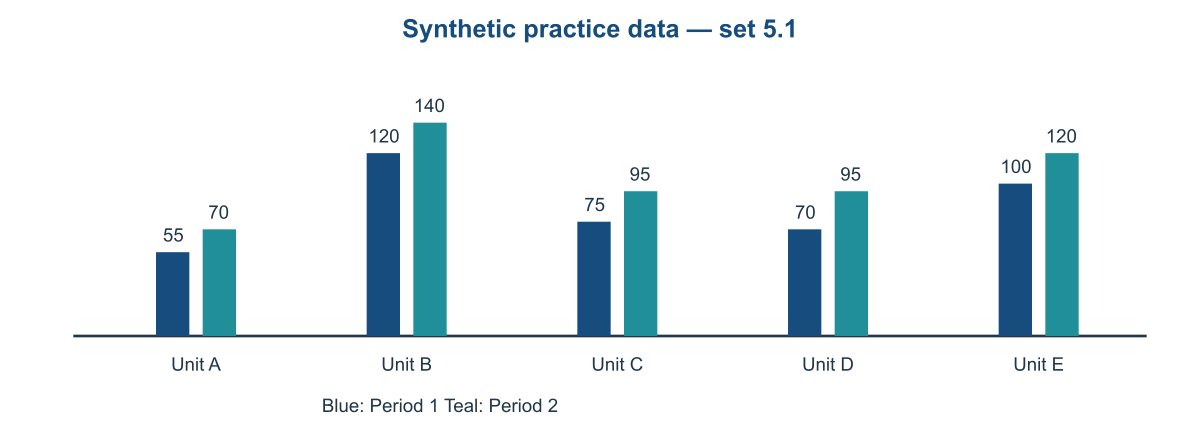
A. 180 B. 170 C. 175 D. 185
2. How much greater is Unit C in the teal series than in the blue series?
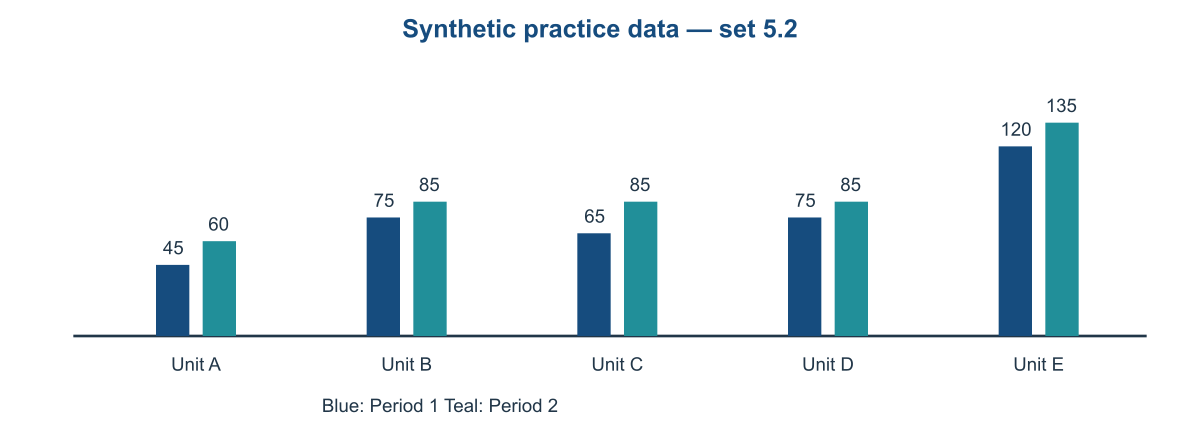
A. 15 B. 30 C. 25 D. 20
3. What is the total across all five teal bars?
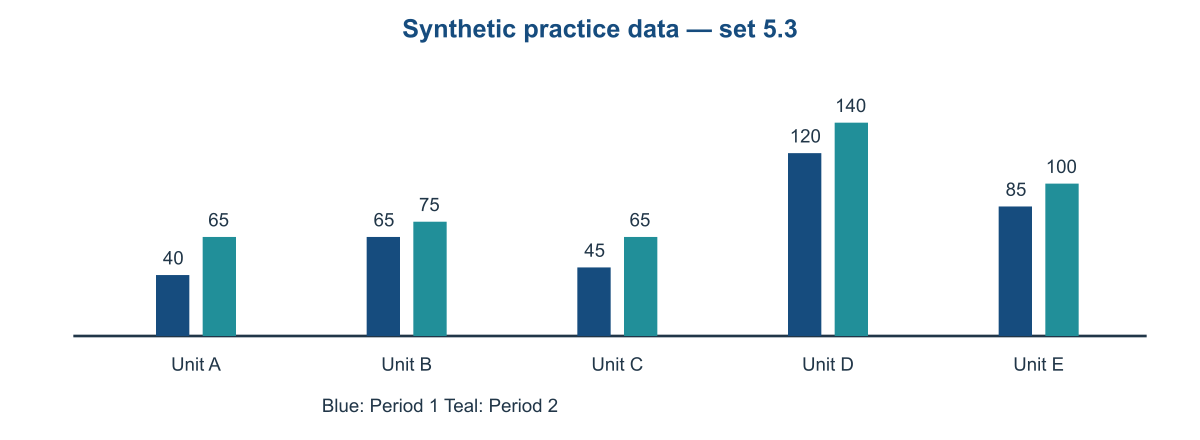
A. 450 B. 455 C. 440 D. 445
4. What is the largest blue-bar value?
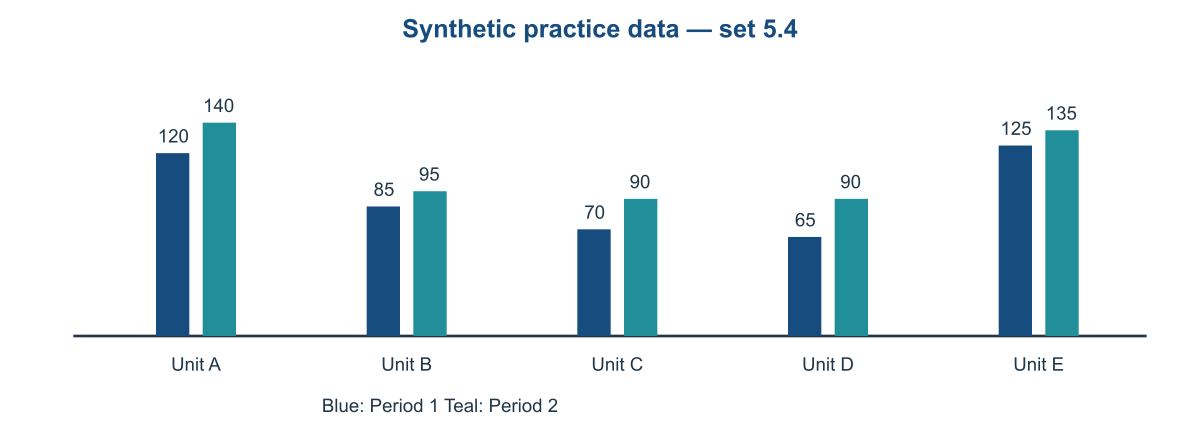
A. 125 B. 130 C. 120 D. 135
5. What is the blue-plus-teal total for Unit E?
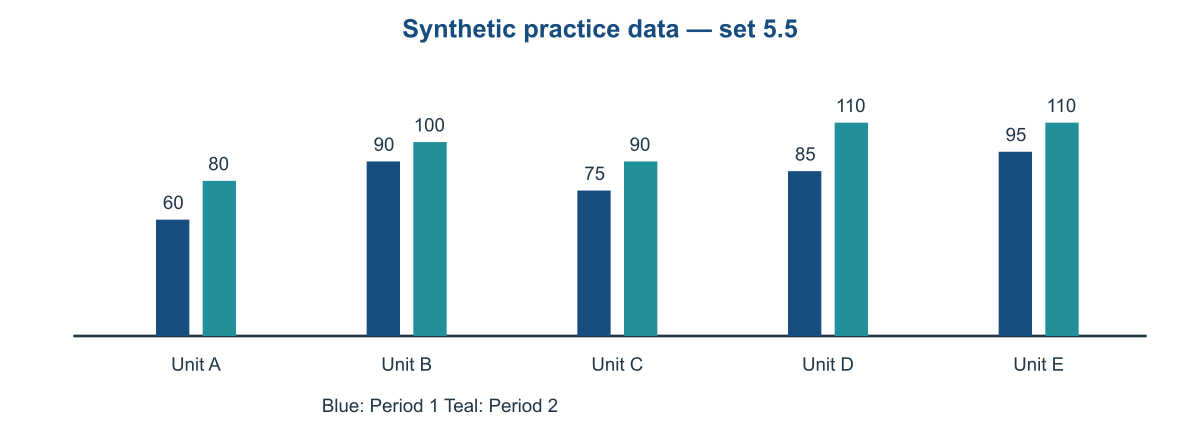
A. 210 B. 200 C. 205 D. 215
6. What is the combined count for Unit A and Unit B in the blue series?
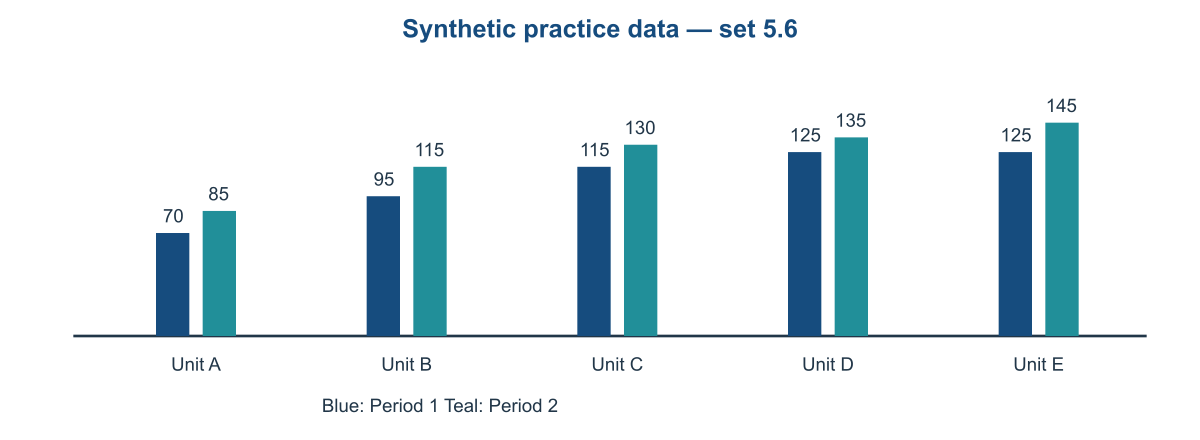
A. 160 B. 175 C. 165 D. 170
7. How much greater is Unit C in the teal series than in the blue series?
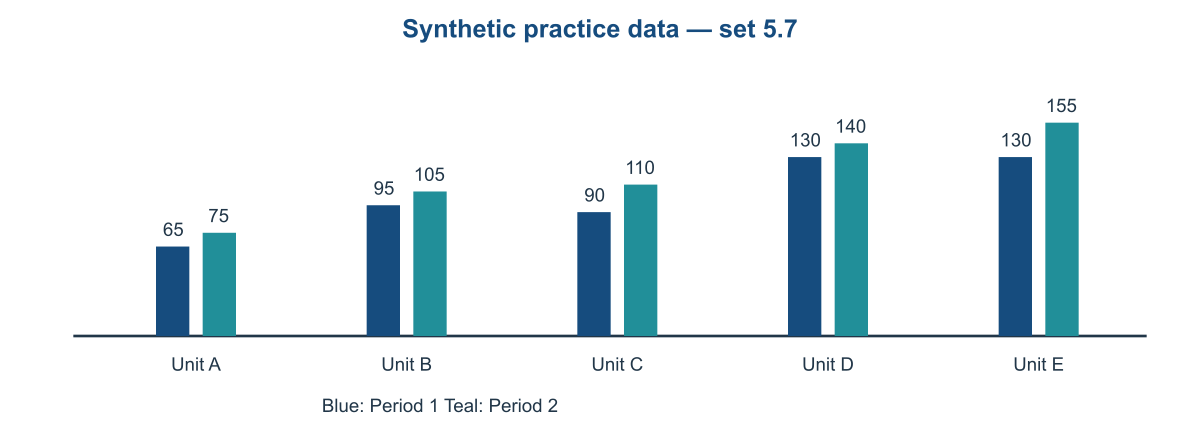
A. 30 B. 20 C. 25 D. 15
8. What is the total across all five teal bars?
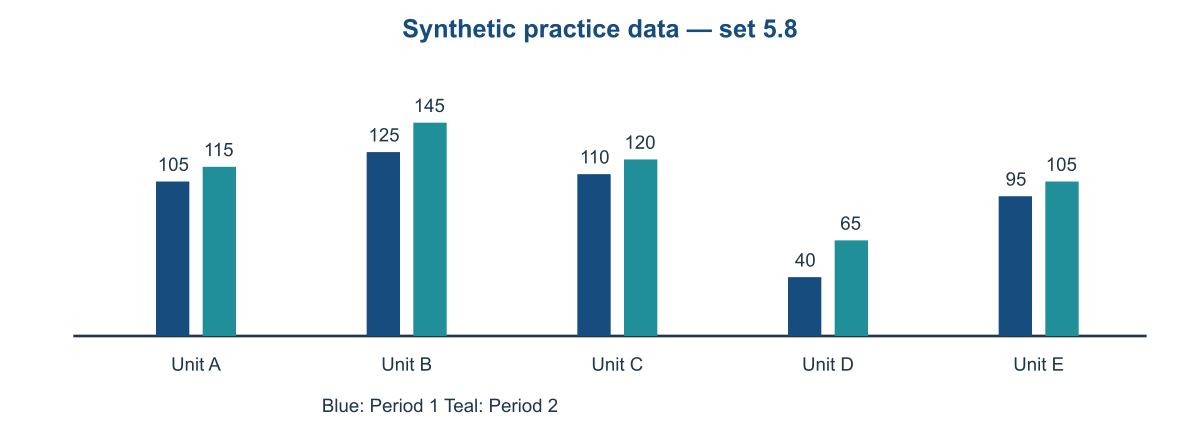
A. 545 B. 560 C. 550 D. 555
9. What is the largest blue-bar value?
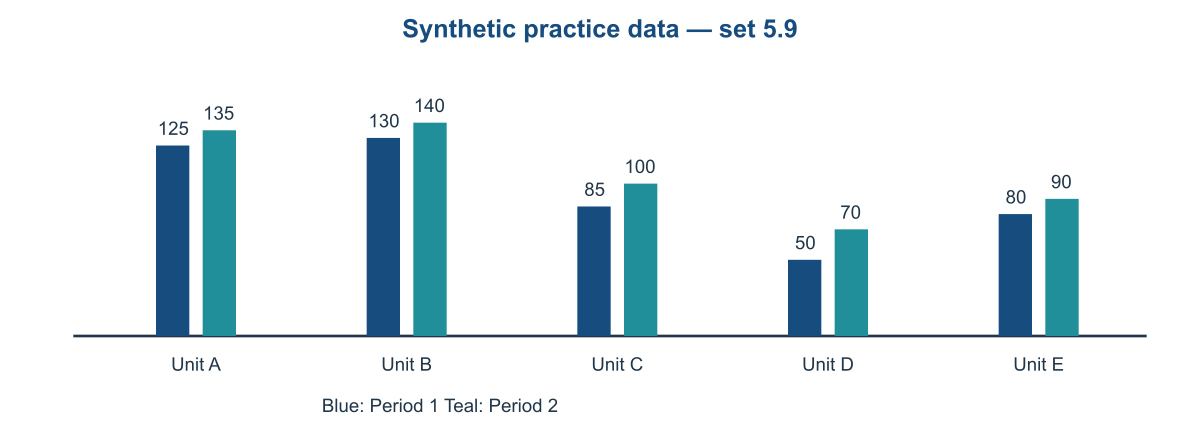
A. 135 B. 140 C. 125 D. 130
10. What is the blue-plus-teal total for Unit E?
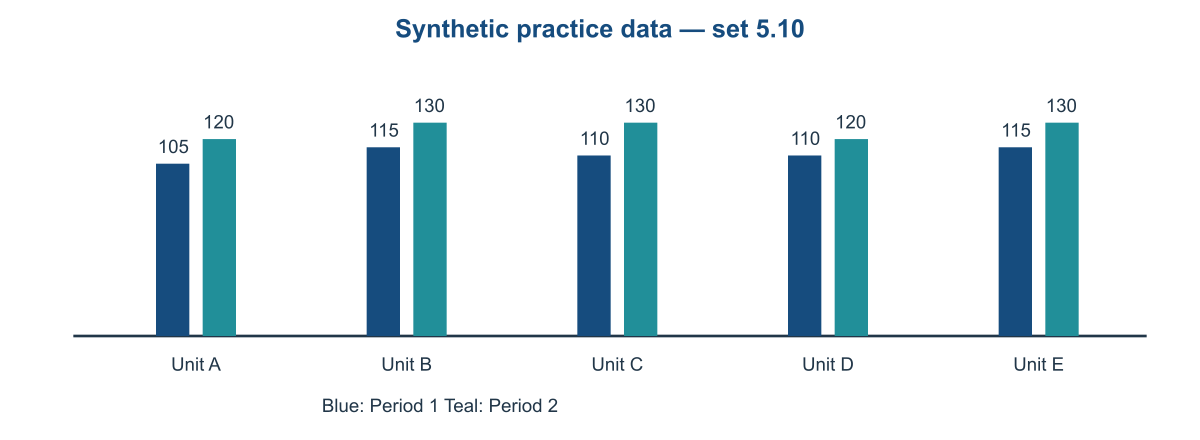
A. 255 B. 240 C. 245 D. 250
11. What is the combined count for Unit A and Unit B in the blue series?
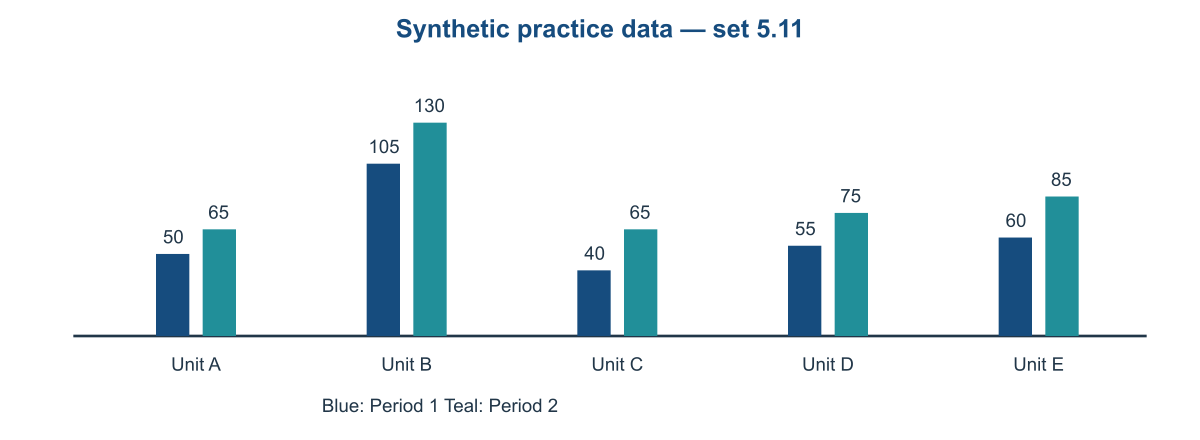
A. 165 B. 160 C. 155 D. 150
12. How much greater is Unit C in the teal series than in the blue series?
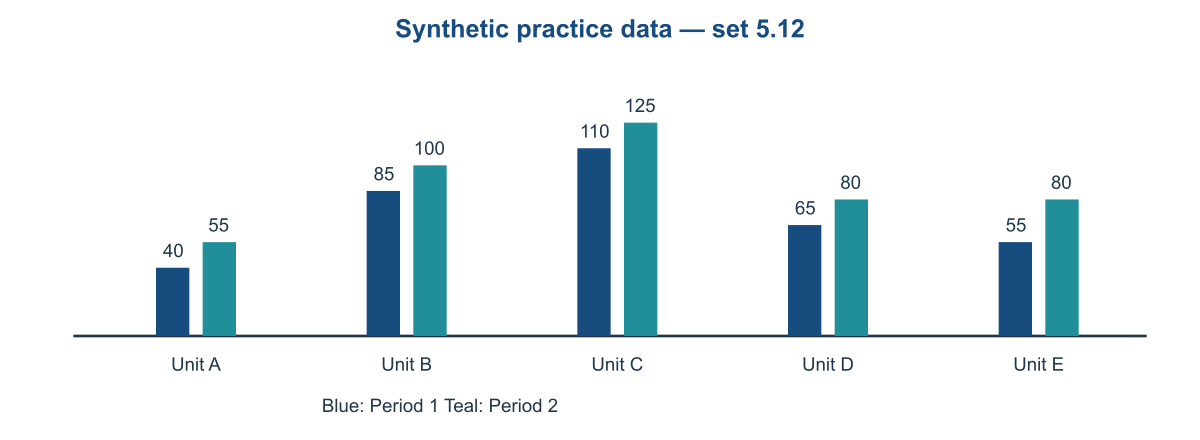
A. 20 B. 25 C. 15 D. 10
13. What is the total across all five teal bars?
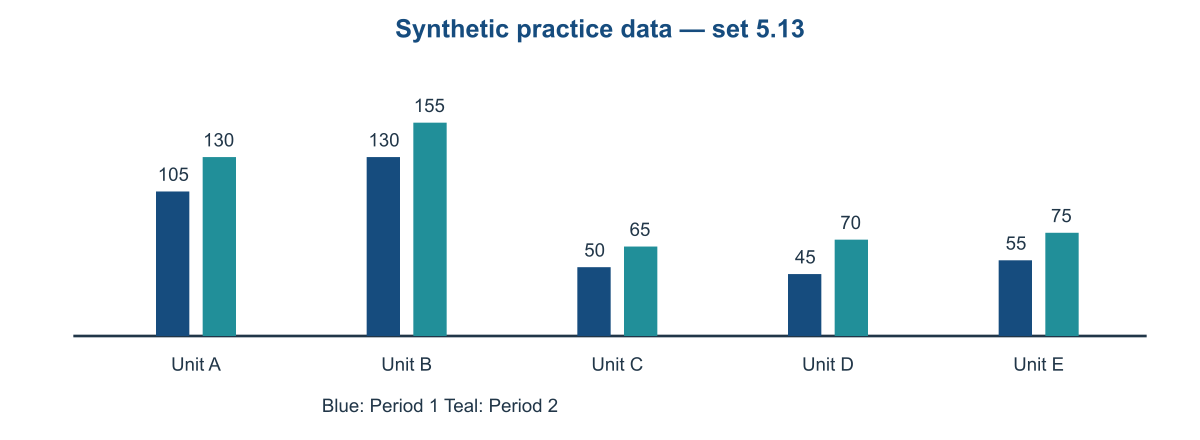
A. 505 B. 495 C. 500 D. 490
14. What is the largest blue-bar value?
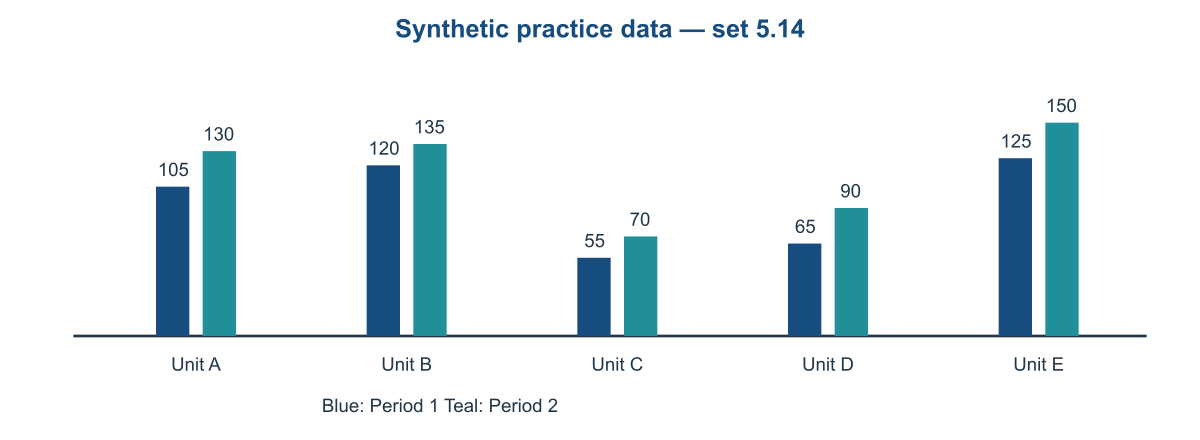
A. 130 B. 135 C. 125 D. 120
15. What is the blue-plus-teal total for Unit E?
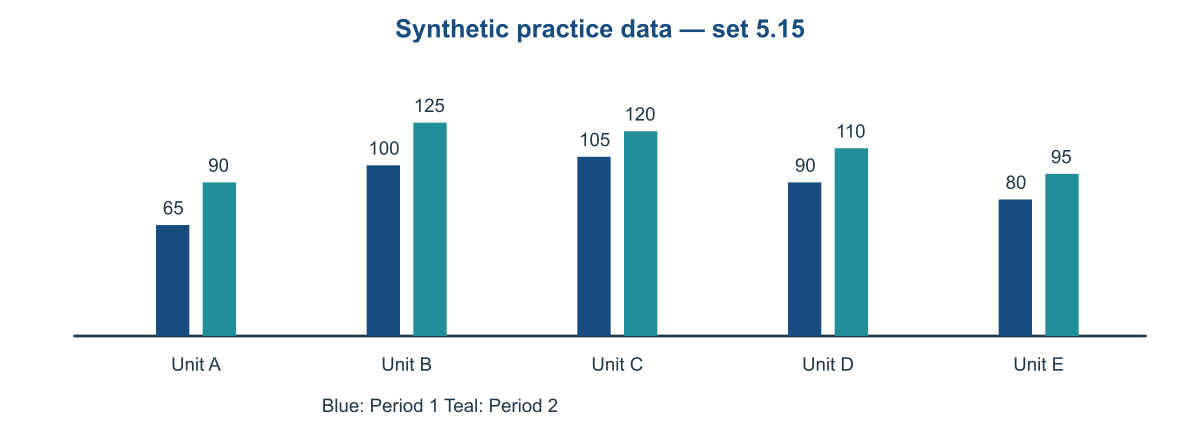
A. 185 B. 180 C. 175 D. 170
16. What is the combined count for Unit A and Unit B in the blue series?
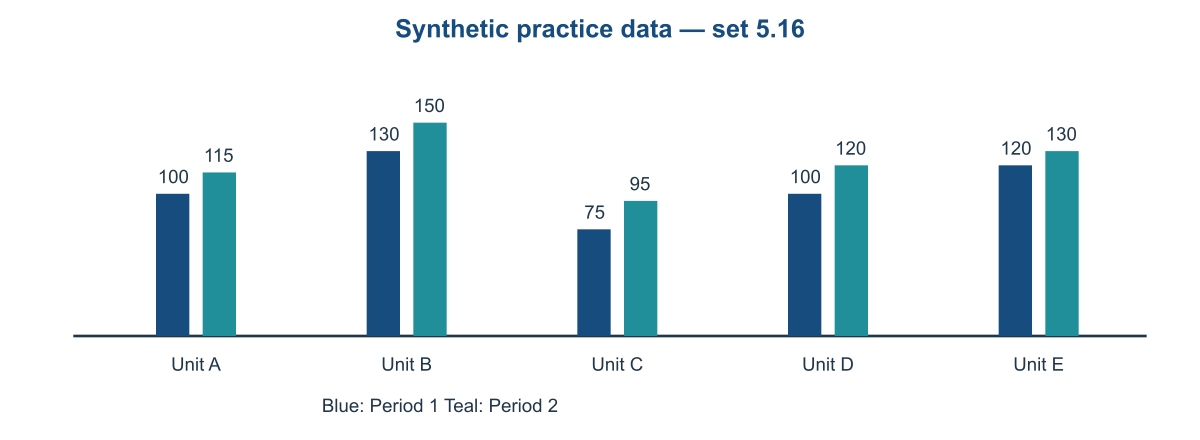
A. 230 B. 225 C. 235 D. 240
17. How much greater is Unit C in the teal series than in the blue series?
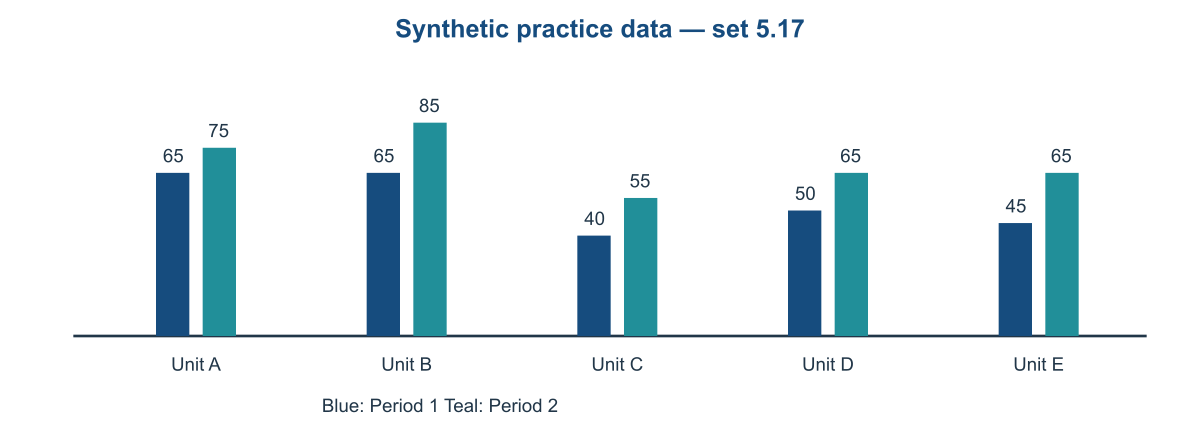
A. 10 B. 15 C. 25 D. 20
18. What is the total across all five teal bars?
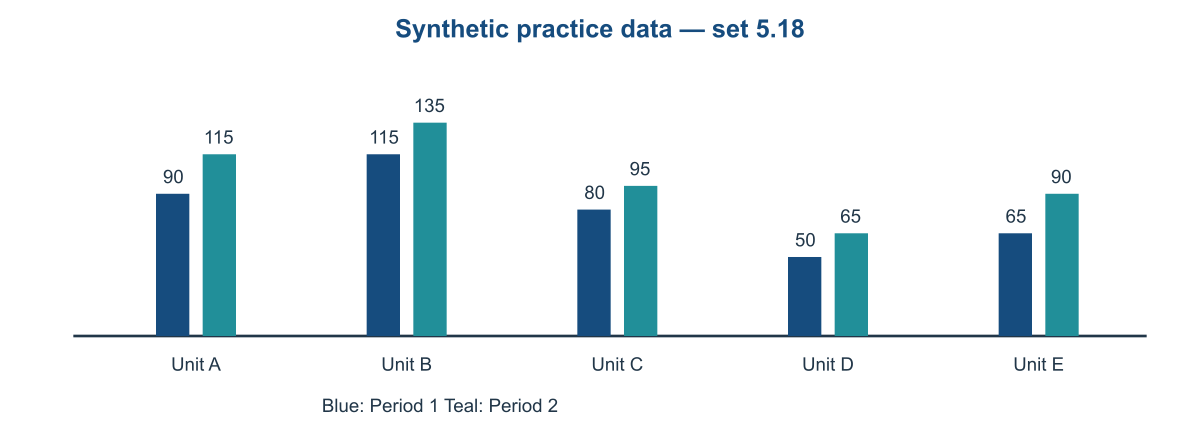
A. 505 B. 510 C. 500 D. 495
19. What is the largest blue-bar value?
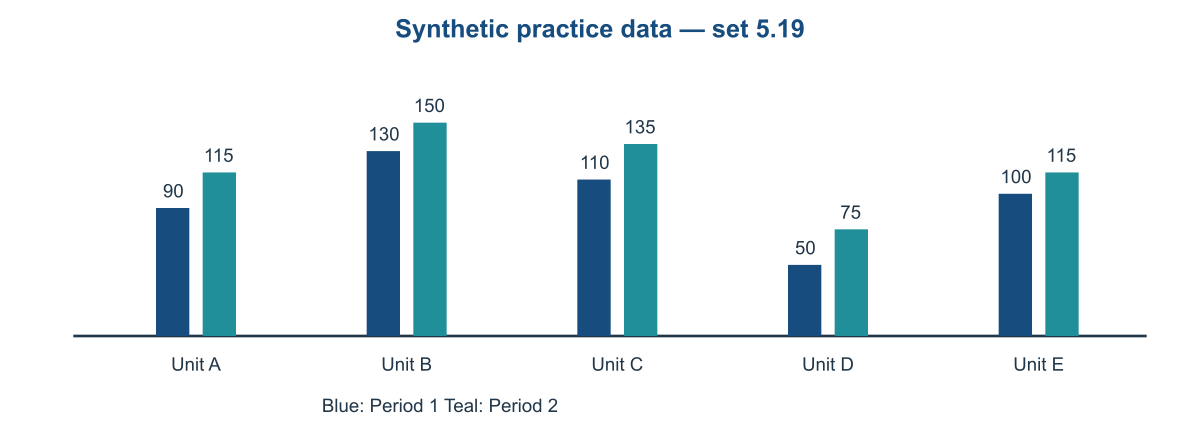
A. 140 B. 130 C. 125 D. 135
20. What is the blue-plus-teal total for Unit E?
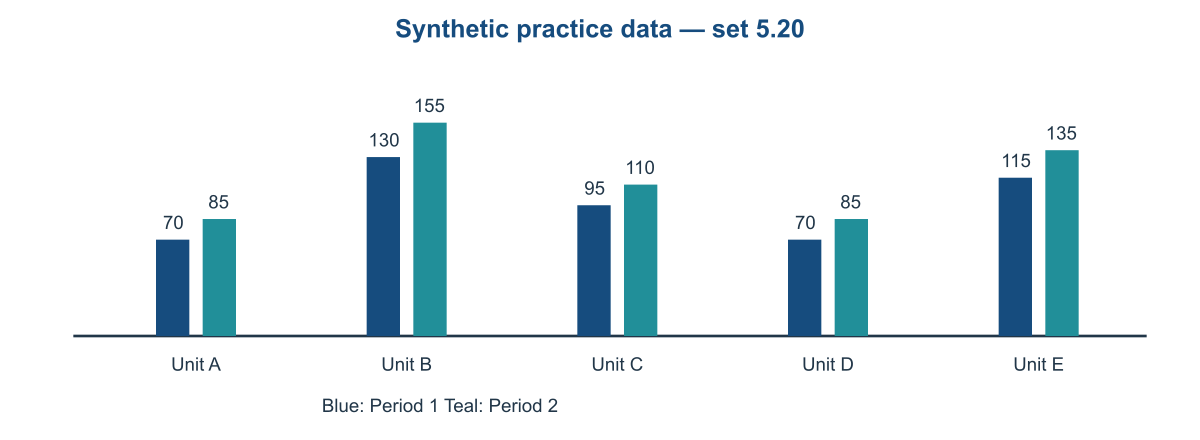
A. 245 B. 255 C. 260 D. 250
21. What is the combined count for Unit A and Unit B in the blue series?
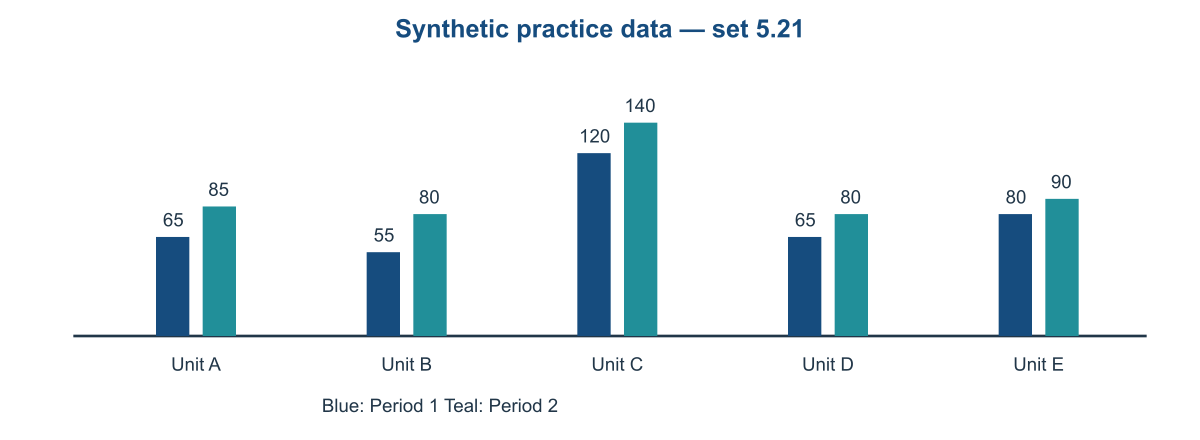
A. 125 B. 120 C. 115 D. 130
22. How much greater is Unit C in the teal series than in the blue series?
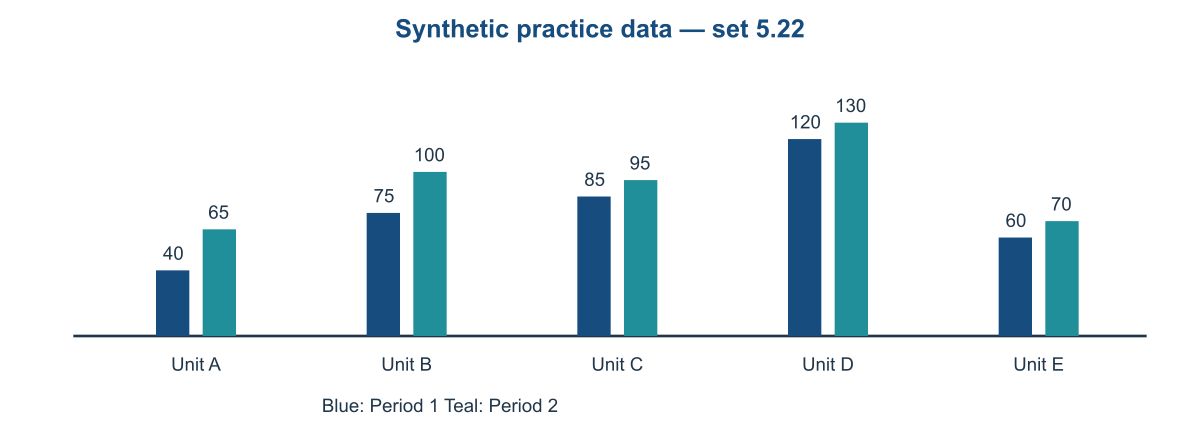
A. 5 B. 20 C. 10 D. 15
23. What is the total across all five teal bars?
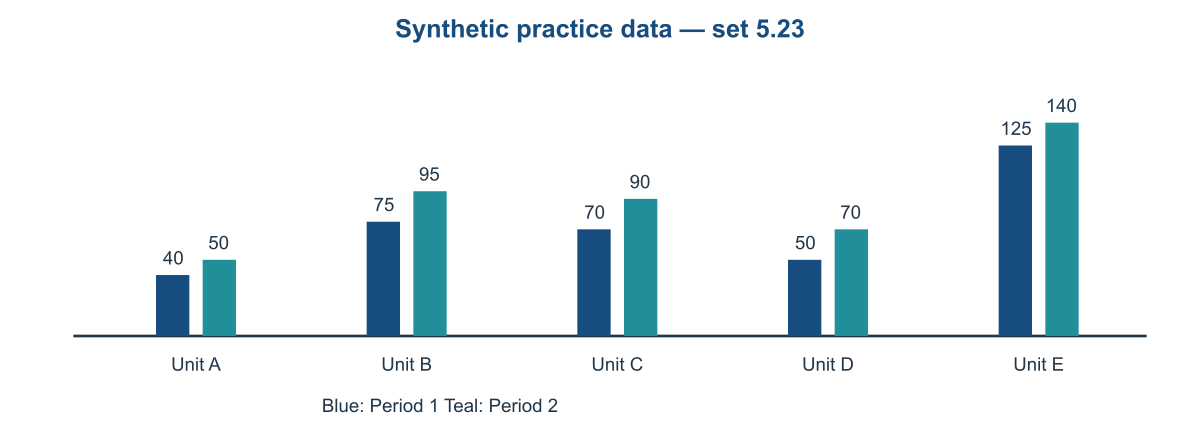
A. 445 B. 455 C. 450 D. 440
24. What is the largest blue-bar value?
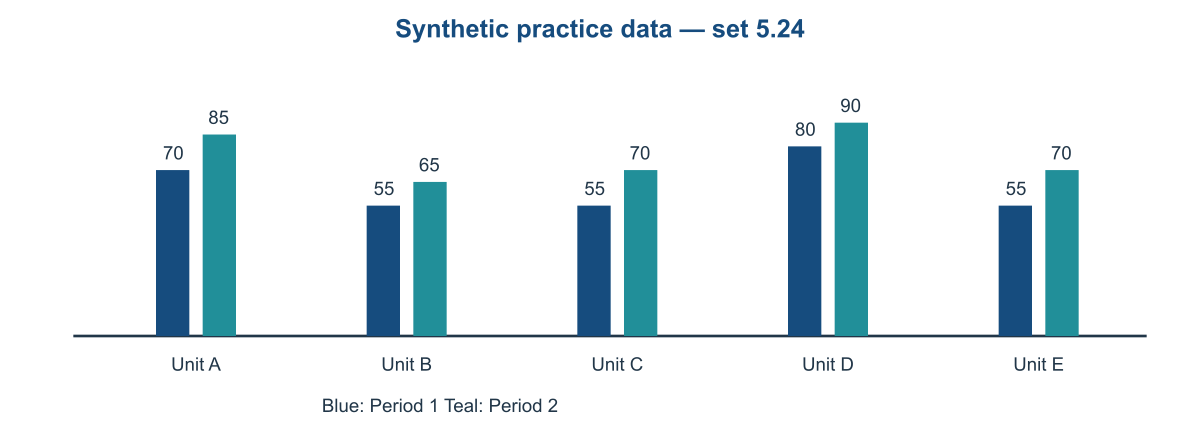
A. 80 B. 75 C. 85 D. 90
25. What is the blue-plus-teal total for Unit E?
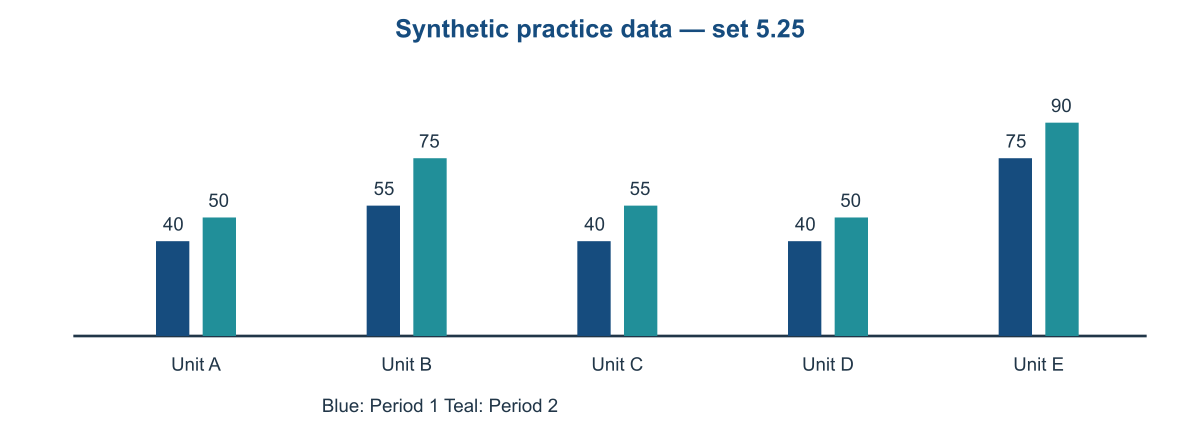
A. 170 B. 175 C. 165 D. 160
26. How many observations fall from 0 up to but not including 20?
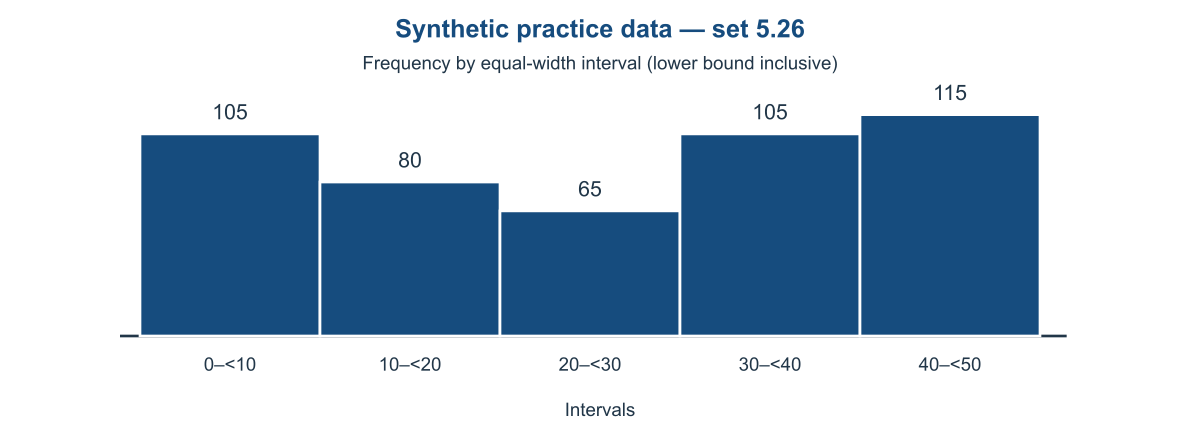
A. 185 B. 190 C. 195 D. 180
27. What is the frequency of the 20–<30 interval?
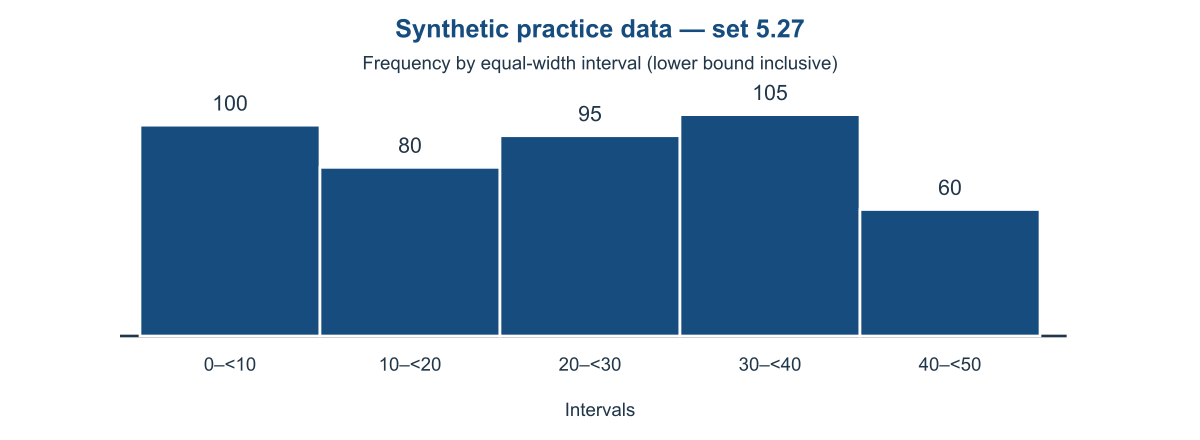
A. 100 B. 95 C. 90 D. 105
28. How many observations are represented by the whole histogram?
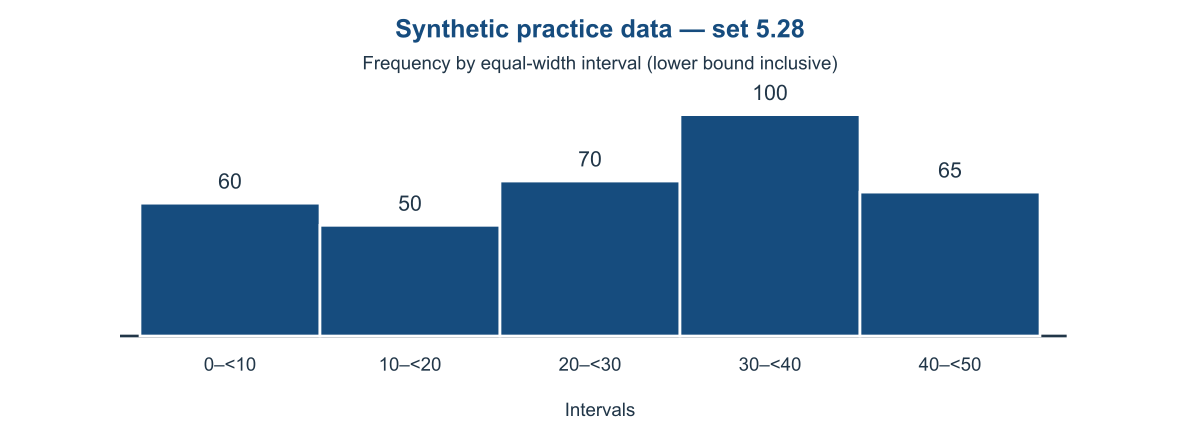
A. 355 B. 340 C. 345 D. 350
29. What is the difference between the largest and smallest interval frequencies?
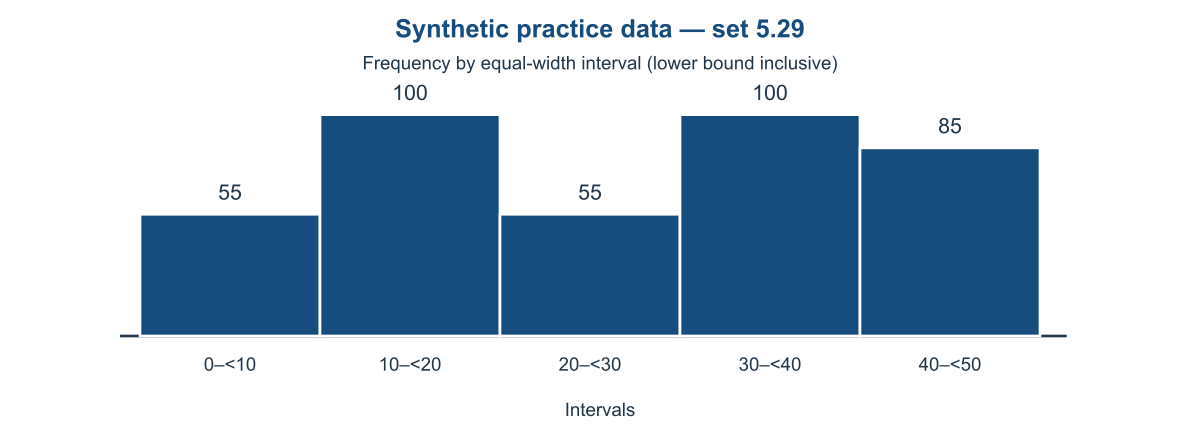
A. 55 B. 45 C. 40 D. 50
30. How many observations are in intervals beginning at 30 or above?
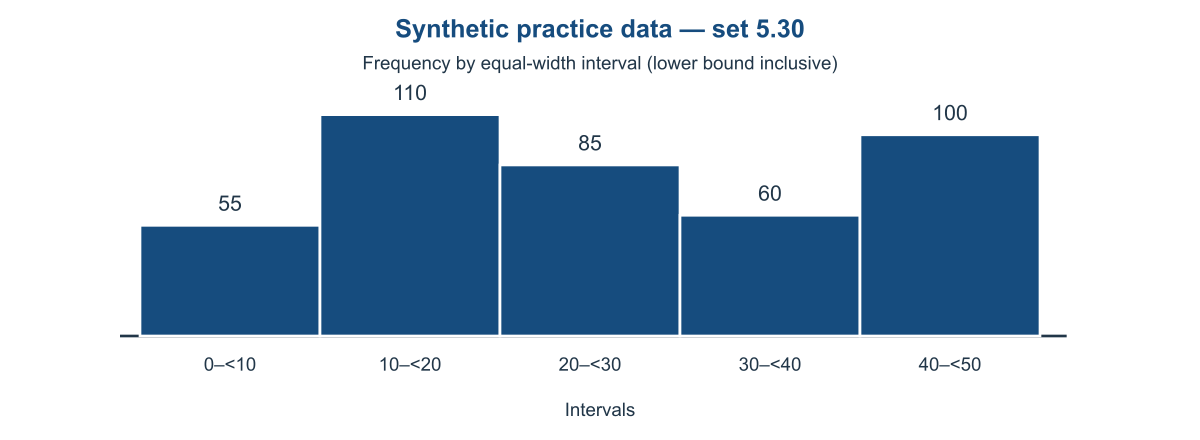
A. 155 B. 170 C. 160 D. 165
31. How many observations fall from 0 up to but not including 20?
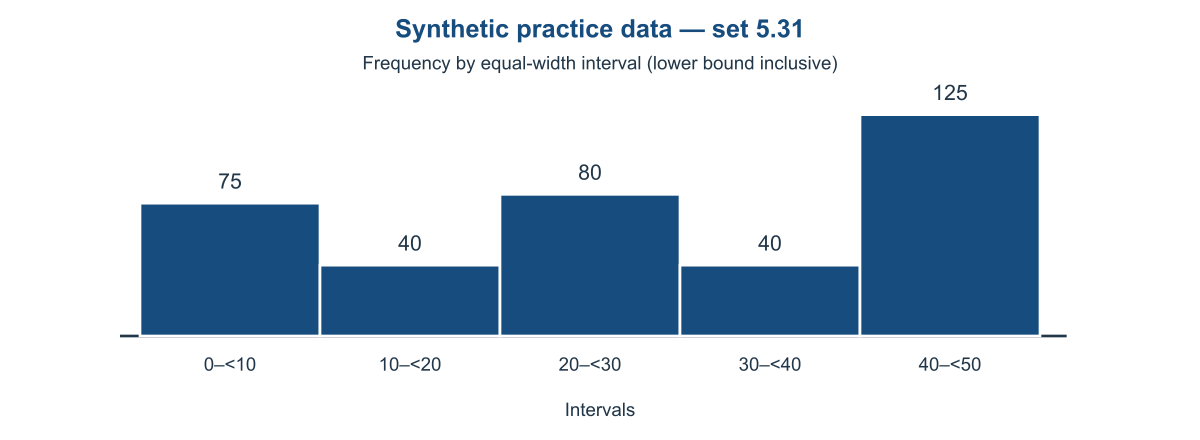
A. 110 B. 120 C. 115 D. 125
32. What is the frequency of the 20–<30 interval?
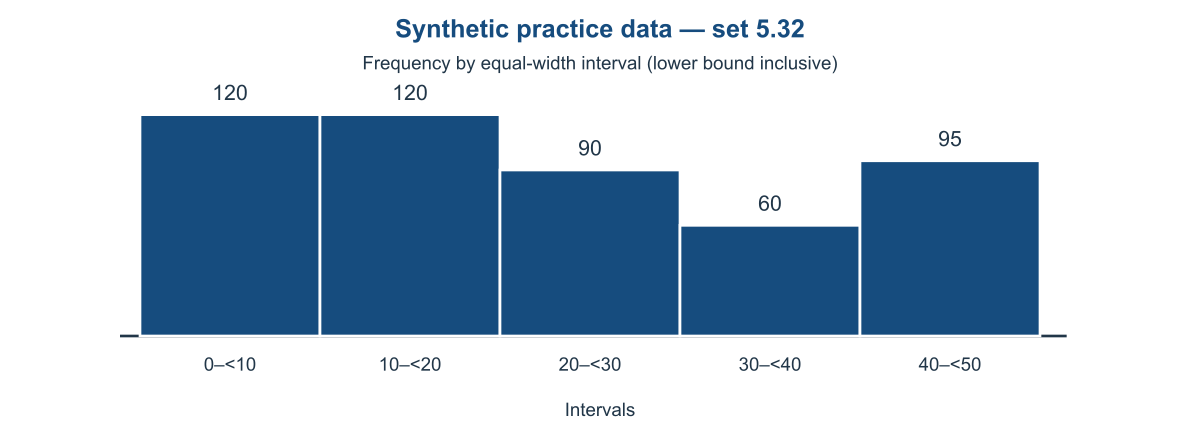
A. 95 B. 85 C. 90 D. 100
33. How many observations are represented by the whole histogram?
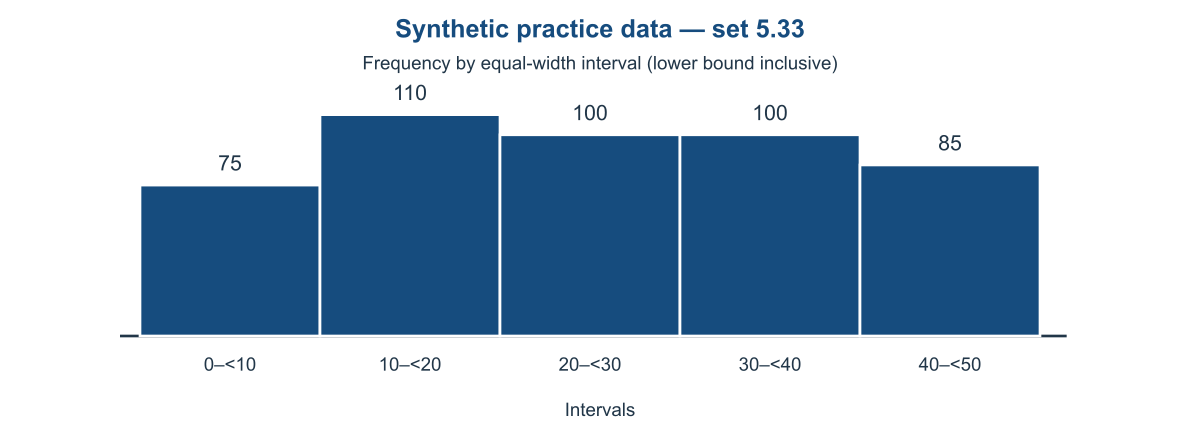
A. 475 B. 470 C. 465 D. 480
34. What is the difference between the largest and smallest interval frequencies?
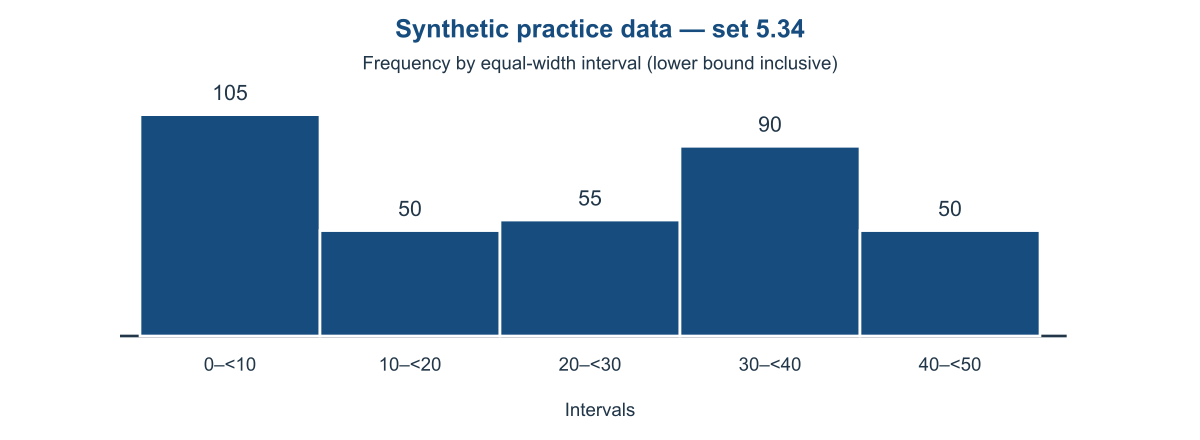
A. 55 B. 50 C. 60 D. 65
35. How many observations are in intervals beginning at 30 or above?
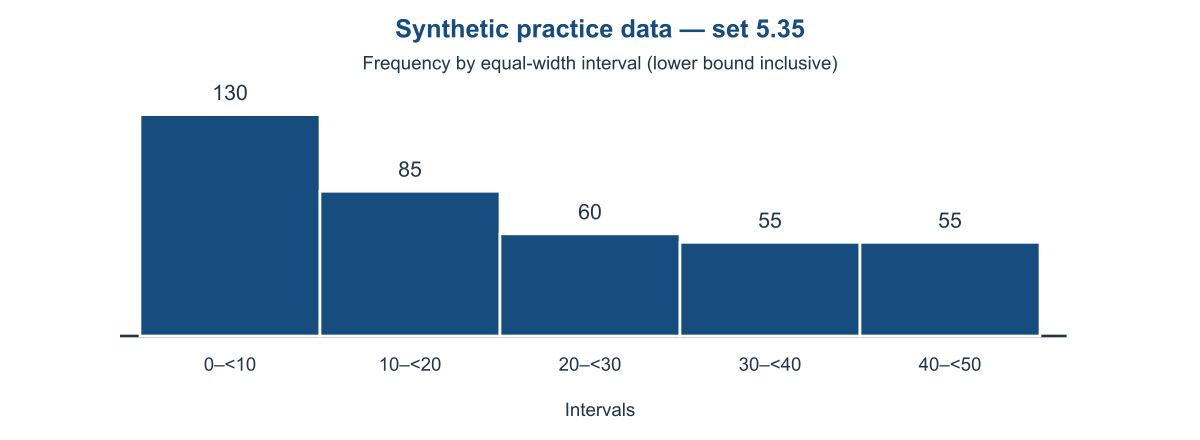
A. 115 B. 105 C. 110 D. 120
36. How many observations fall from 0 up to but not including 20?
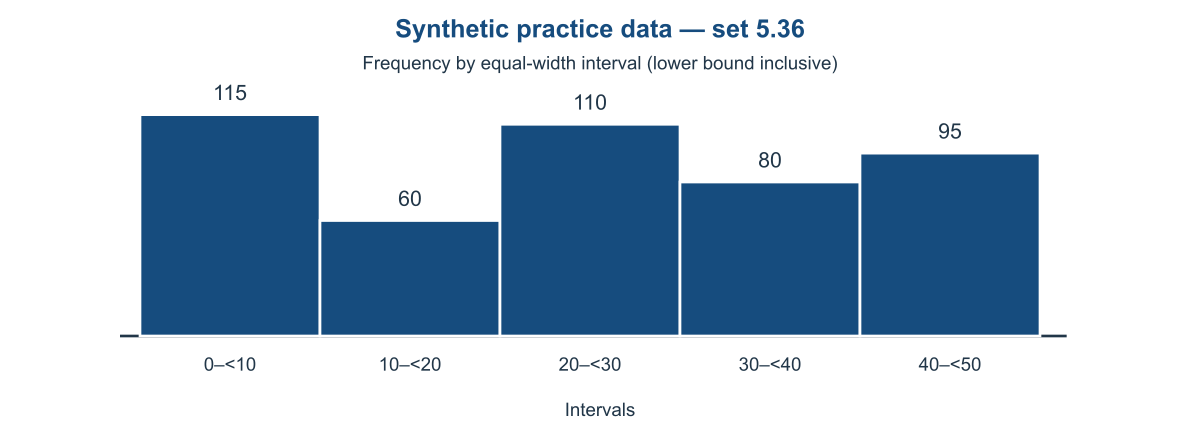
A. 175 B. 170 C. 180 D. 185
37. What is the frequency of the 20–<30 interval?
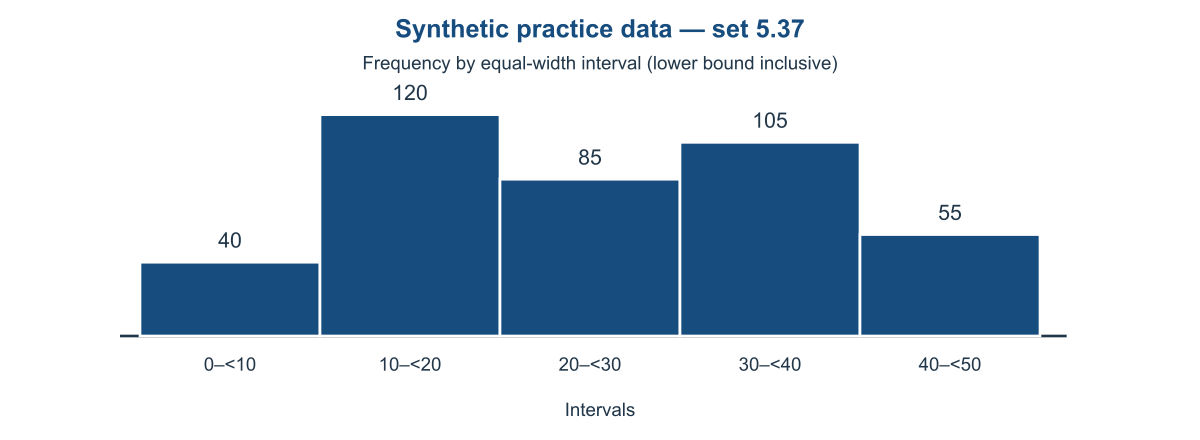
A. 85 B. 90 C. 80 D. 95
38. How many observations are represented by the whole histogram?
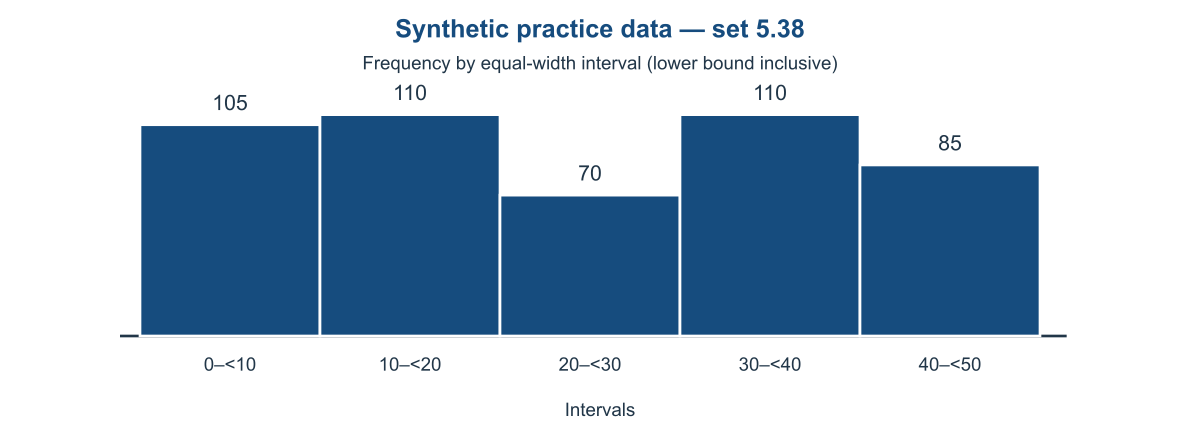
A. 475 B. 480 C. 490 D. 485
39. What is the difference between the largest and smallest interval frequencies?
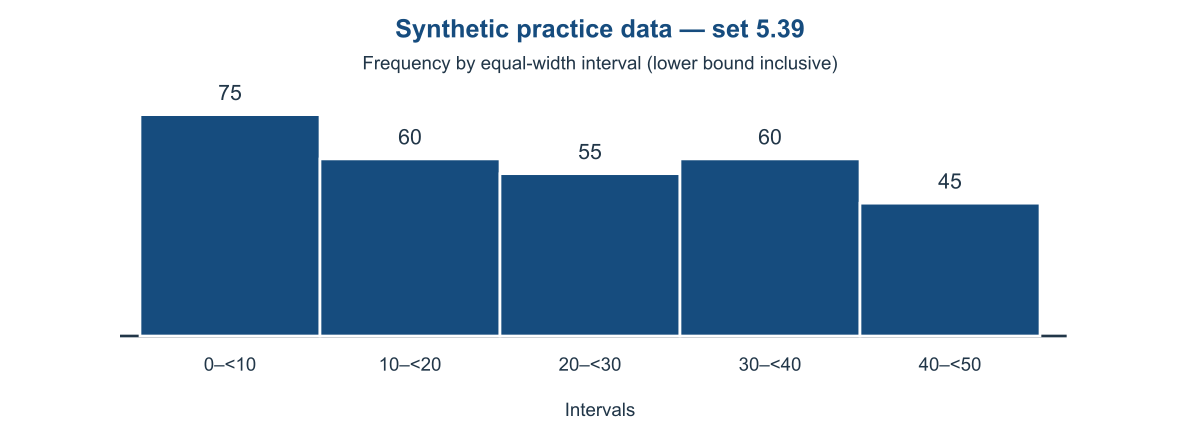
A. 35 B. 30 C. 40 D. 25
40. How many observations are in intervals beginning at 30 or above?
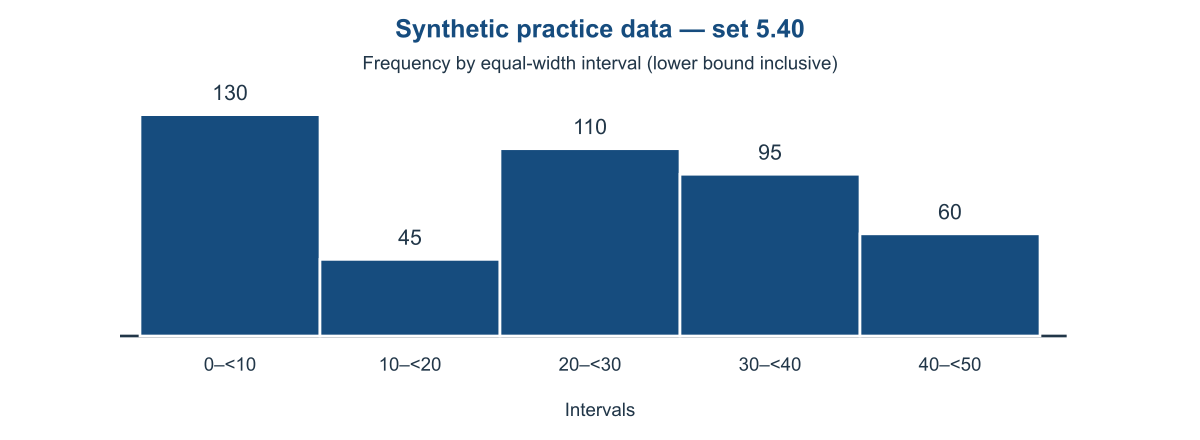
A. 165 B. 150 C. 155 D. 160
41. How many observations fall from 0 up to but not including 20?
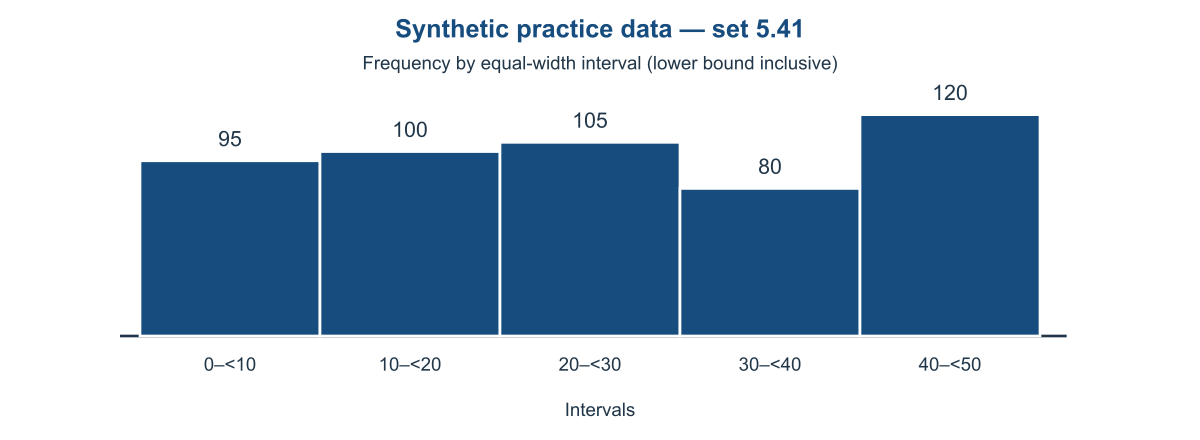
A. 190 B. 195 C. 200 D. 205
42. What is the frequency of the 20–<30 interval?
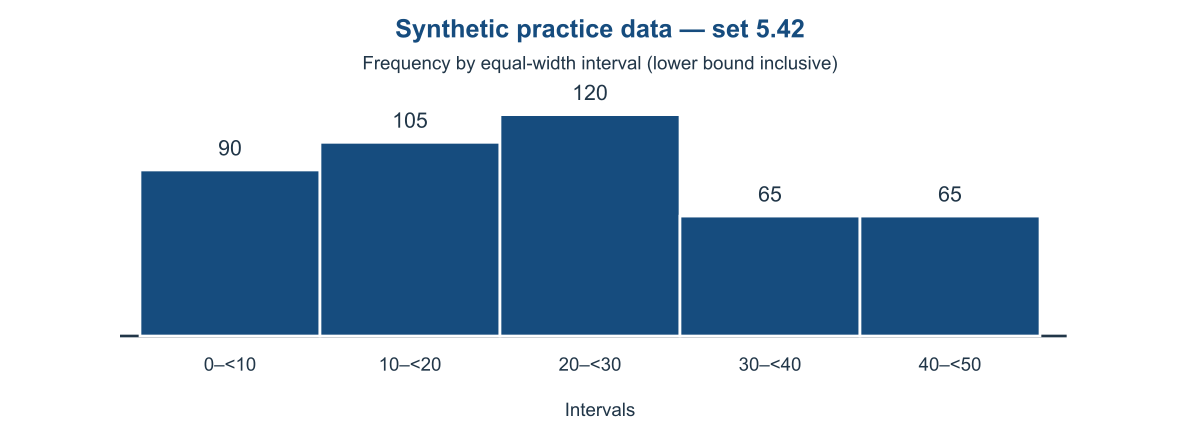
A. 115 B. 125 C. 130 D. 120
43. How many observations are represented by the whole histogram?
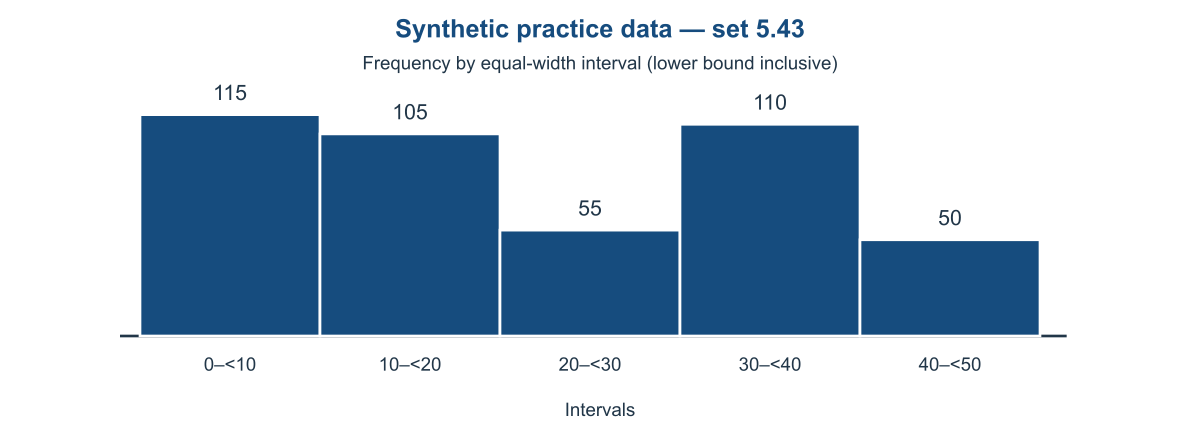
A. 445 B. 440 C. 430 D. 435
44. What is the difference between the largest and smallest interval frequencies?
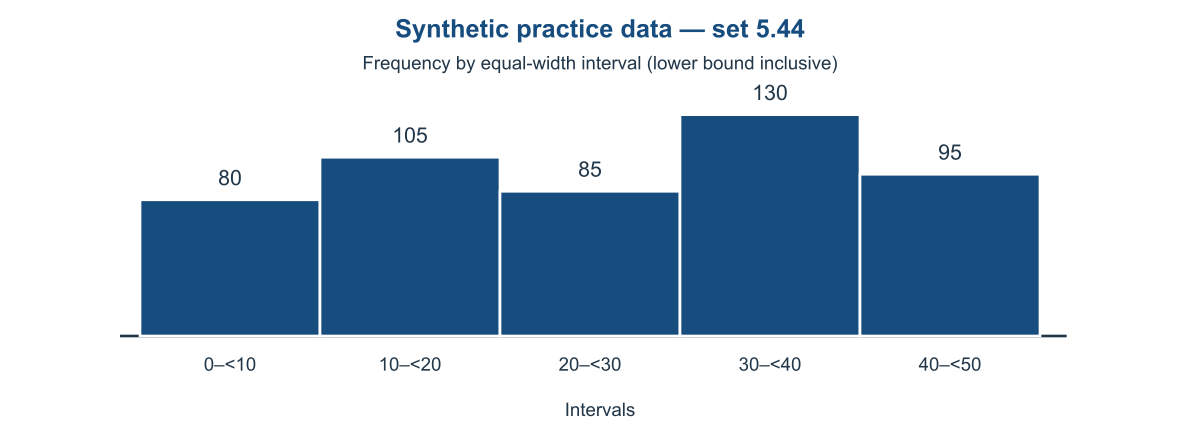
A. 60 B. 45 C. 55 D. 50
45. How many observations are in intervals beginning at 30 or above?
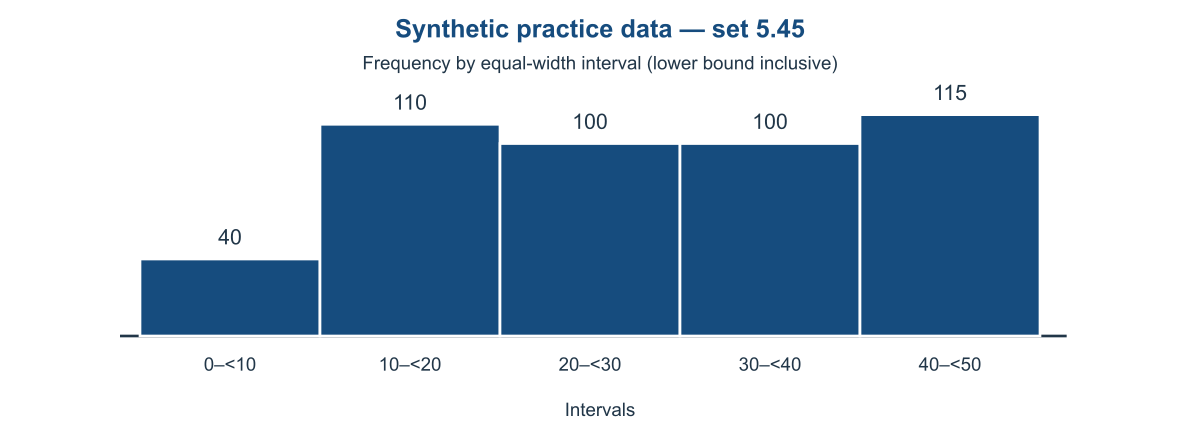
A. 215 B. 220 C. 210 D. 225
46. How many observations fall from 0 up to but not including 20?
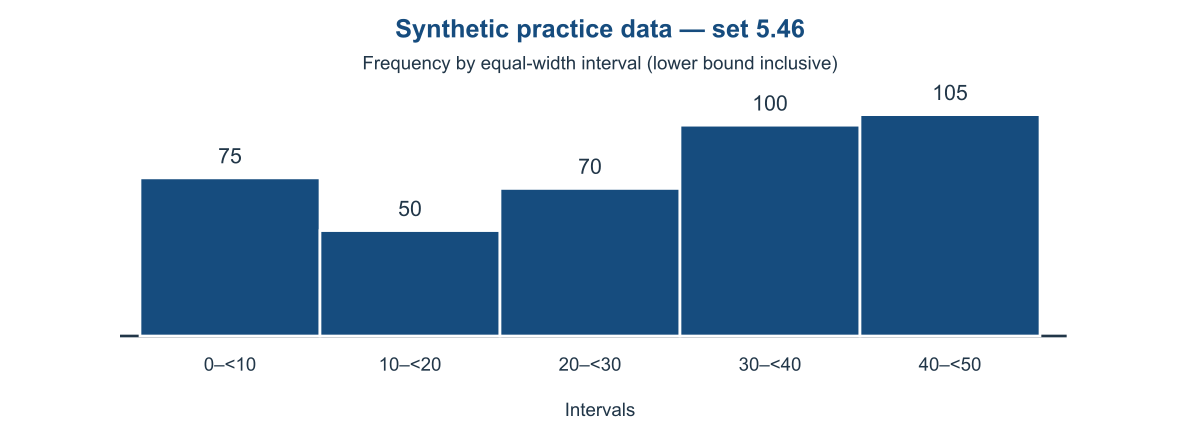
A. 125 B. 130 C. 120 D. 135
47. What is the frequency of the 20–<30 interval?
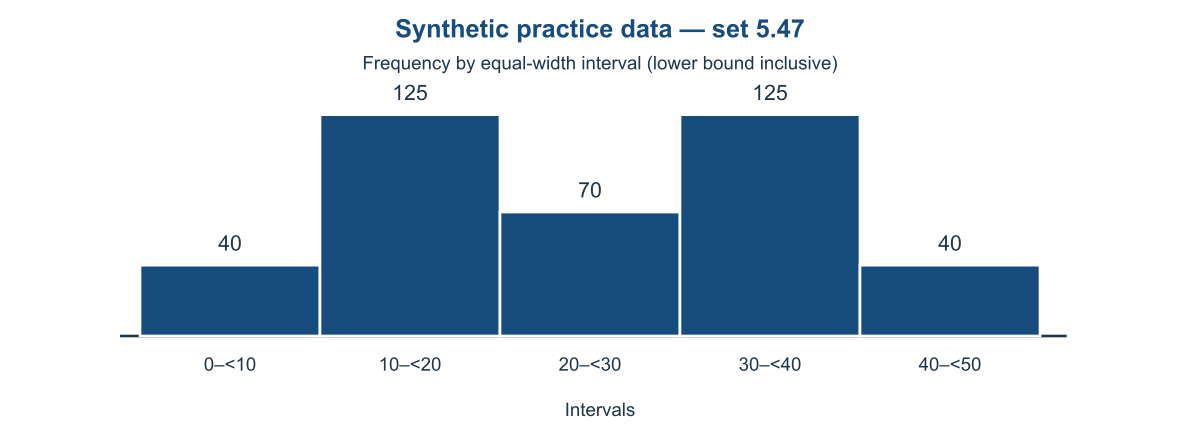
A. 80 B. 70 C. 65 D. 75
48. How many observations are represented by the whole histogram?
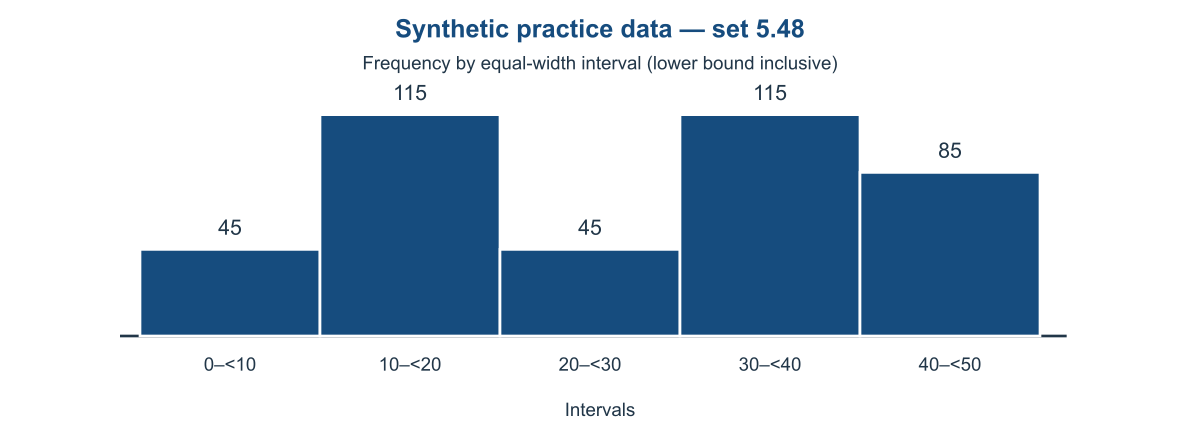
A. 415 B. 400 C. 405 D. 410
49. What is the difference between the largest and smallest interval frequencies?
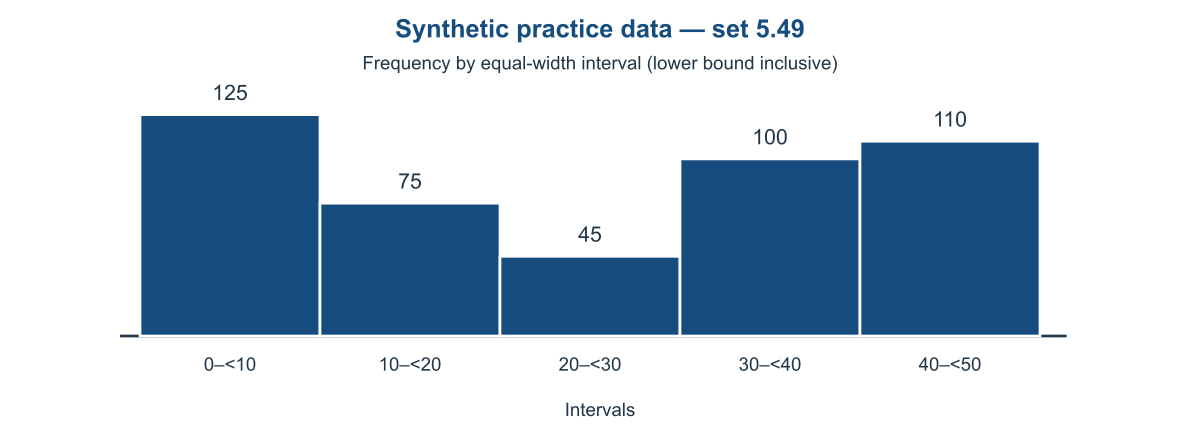
A. 75 B. 85 C. 80 D. 90
50. How many observations are in intervals beginning at 30 or above?
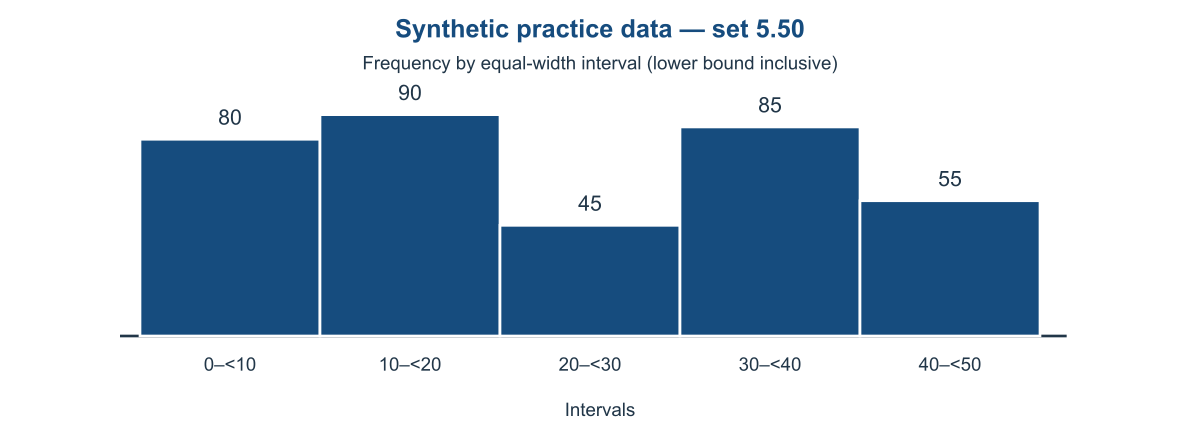
A. 135 B. 140 C. 145 D. 150
Answers and explanations
Check the value and the unit before comparing your working with the calculation.
1. C. Blue Unit A is 55 and B is 120; add to get 175.
APDI26-05-01 | bar-charts | Easy
2. D. Unit C is 85 (teal) versus 65 (blue); difference 20.
APDI26-05-02 | bar-charts | Easy
3. D. Add the teal values [65, 75, 65, 140, 100]; total 445.
APDI26-05-03 | bar-charts | Easy
4. A. The blue values are [120, 85, 70, 65, 125]; the largest is 125.
APDI26-05-04 | bar-charts | Easy
5. C. Unit E has 95 blue and 110 teal; total 205.
APDI26-05-05 | bar-charts | Easy
6. C. Blue Unit A is 70 and B is 95; add to get 165.
APDI26-05-06 | bar-charts | Easy
7. B. Unit C is 110 (teal) versus 90 (blue); difference 20.
APDI26-05-07 | bar-charts | Easy
8. C. Add the teal values [115, 145, 120, 65, 105]; total 550.
APDI26-05-08 | bar-charts | Easy
9. D. The blue values are [125, 130, 85, 50, 80]; the largest is 130.
APDI26-05-09 | bar-charts | Medium
10. C. Unit E has 115 blue and 130 teal; total 245.
APDI26-05-10 | bar-charts | Medium
11. C. Blue Unit A is 50 and B is 105; add to get 155.
APDI26-05-11 | bar-charts | Medium
12. C. Unit C is 125 (teal) versus 110 (blue); difference 15.
APDI26-05-12 | bar-charts | Medium
13. B. Add the teal values [130, 155, 65, 70, 75]; total 495.
APDI26-05-13 | bar-charts | Medium
14. C. The blue values are [105, 120, 55, 65, 125]; the largest is 125.
APDI26-05-14 | bar-charts | Medium
15. C. Unit E has 80 blue and 95 teal; total 175.
APDI26-05-15 | bar-charts | Medium
16. A. Blue Unit A is 100 and B is 130; add to get 230.
APDI26-05-16 | bar-charts | Medium
17. B. Unit C is 55 (teal) versus 40 (blue); difference 15.
APDI26-05-17 | bar-charts | Medium
18. C. Add the teal values [115, 135, 95, 65, 90]; total 500.
APDI26-05-18 | bar-charts | Medium
19. B. The blue values are [90, 130, 110, 50, 100]; the largest is 130.
APDI26-05-19 | bar-charts | Medium
20. D. Unit E has 115 blue and 135 teal; total 250.
APDI26-05-20 | bar-charts | Medium
21. B. Blue Unit A is 65 and B is 55; add to get 120.
APDI26-05-21 | bar-charts | Medium
22. C. Unit C is 95 (teal) versus 85 (blue); difference 10.
APDI26-05-22 | bar-charts | Difficult
23. A. Add the teal values [50, 95, 90, 70, 140]; total 445.
APDI26-05-23 | bar-charts | Difficult
24. A. The blue values are [70, 55, 55, 80, 55]; the largest is 80.
APDI26-05-24 | bar-charts | Difficult
25. C. Unit E has 75 blue and 90 teal; total 165.
APDI26-05-25 | bar-charts | Difficult
26. A. Add the first two interval frequencies: 105+80=185.
APDI26-05-26 | histogram | Easy
27. B. Read the labelled height of the 20–<30 bar: 95 observations.
APDI26-05-27 | histogram | Easy
28. C. Add all five interval frequencies [60, 50, 70, 100, 65]: 345 observations.
APDI26-05-28 | histogram | Easy
29. B. Largest frequency 100 minus smallest 55 gives 45.
APDI26-05-29 | histogram | Easy
30. C. Add the 30–<40 and 40–<50 frequencies: 60+100=160.
APDI26-05-30 | histogram | Easy
31. C. Add the first two interval frequencies: 75+40=115.
APDI26-05-31 | histogram | Easy
32. C. Read the labelled height of the 20–<30 bar: 90 observations.
APDI26-05-32 | histogram | Easy
33. B. Add all five interval frequencies [75, 110, 100, 100, 85]: 470 observations.
APDI26-05-33 | histogram | Easy
34. A. Largest frequency 105 minus smallest 50 gives 55.
APDI26-05-34 | histogram | Medium
35. C. Add the 30–<40 and 40–<50 frequencies: 55+55=110.
APDI26-05-35 | histogram | Medium
36. A. Add the first two interval frequencies: 115+60=175.
APDI26-05-36 | histogram | Medium
37. A. Read the labelled height of the 20–<30 bar: 85 observations.
APDI26-05-37 | histogram | Medium
38. B. Add all five interval frequencies [105, 110, 70, 110, 85]: 480 observations.
APDI26-05-38 | histogram | Medium
39. B. Largest frequency 75 minus smallest 45 gives 30.
APDI26-05-39 | histogram | Medium
40. C. Add the 30–<40 and 40–<50 frequencies: 95+60=155.
APDI26-05-40 | histogram | Medium
41. B. Add the first two interval frequencies: 95+100=195.
APDI26-05-41 | histogram | Medium
42. D. Read the labelled height of the 20–<30 bar: 120 observations.
APDI26-05-42 | histogram | Medium
43. D. Add all five interval frequencies [115, 105, 55, 110, 50]: 435 observations.
APDI26-05-43 | histogram | Medium
44. D. Largest frequency 130 minus smallest 80 gives 50.
APDI26-05-44 | histogram | Medium
45. A. Add the 30–<40 and 40–<50 frequencies: 100+115=215.
APDI26-05-45 | histogram | Medium
46. A. Add the first two interval frequencies: 75+50=125.
APDI26-05-46 | histogram | Medium
47. B. Read the labelled height of the 20–<30 bar: 70 observations.
APDI26-05-47 | histogram | Difficult
48. C. Add all five interval frequencies [45, 115, 45, 115, 85]: 405 observations.
APDI26-05-48 | histogram | Difficult
49. C. Largest frequency 125 minus smallest 45 gives 80.
APDI26-05-49 | histogram | Difficult
50. B. Add the 30–<40 and 40–<50 frequencies: 85+55=140.
APDI26-05-50 | histogram | Difficult