Crop statistics use several measures: area, yield and production. Crop-cutting experiments and estimation surveys help produce objective yield and output estimates for major crops. Prakasam district's Chief Planning Office describes surveys in Kharif and Rabi and lists food and non-food crops. APSAC's satellite monitoring can map crop condition and support analysis, but it should not be mistaken for the sole final crop-yield measure.
An exam may give a table in lakh hectares and lakh tonnes. Always check whether a number is area or production before comparing districts. Productivity is production divided by area, commonly expressed per hectare. A high-producing region may not have the highest per-hectare yield. Preliminary estimates can be revised, and present district boundaries may not match an older table. For a current-affairs figure, record crop year, source, release date, unit and district vintage.
Worked example: A crop-cutting survey estimates yield from sampled plots, while area reports record planted extent. Multiplying area by estimated yield gives production, but changes in sampling or district boundaries affect comparisons. If a 2022 district was split later, its historical production cannot simply be assigned to one new district. Always write crop year, season, geography and unit.
Active recall: State the relation among area, yield and production. Why can a production rank differ from a yield rank?
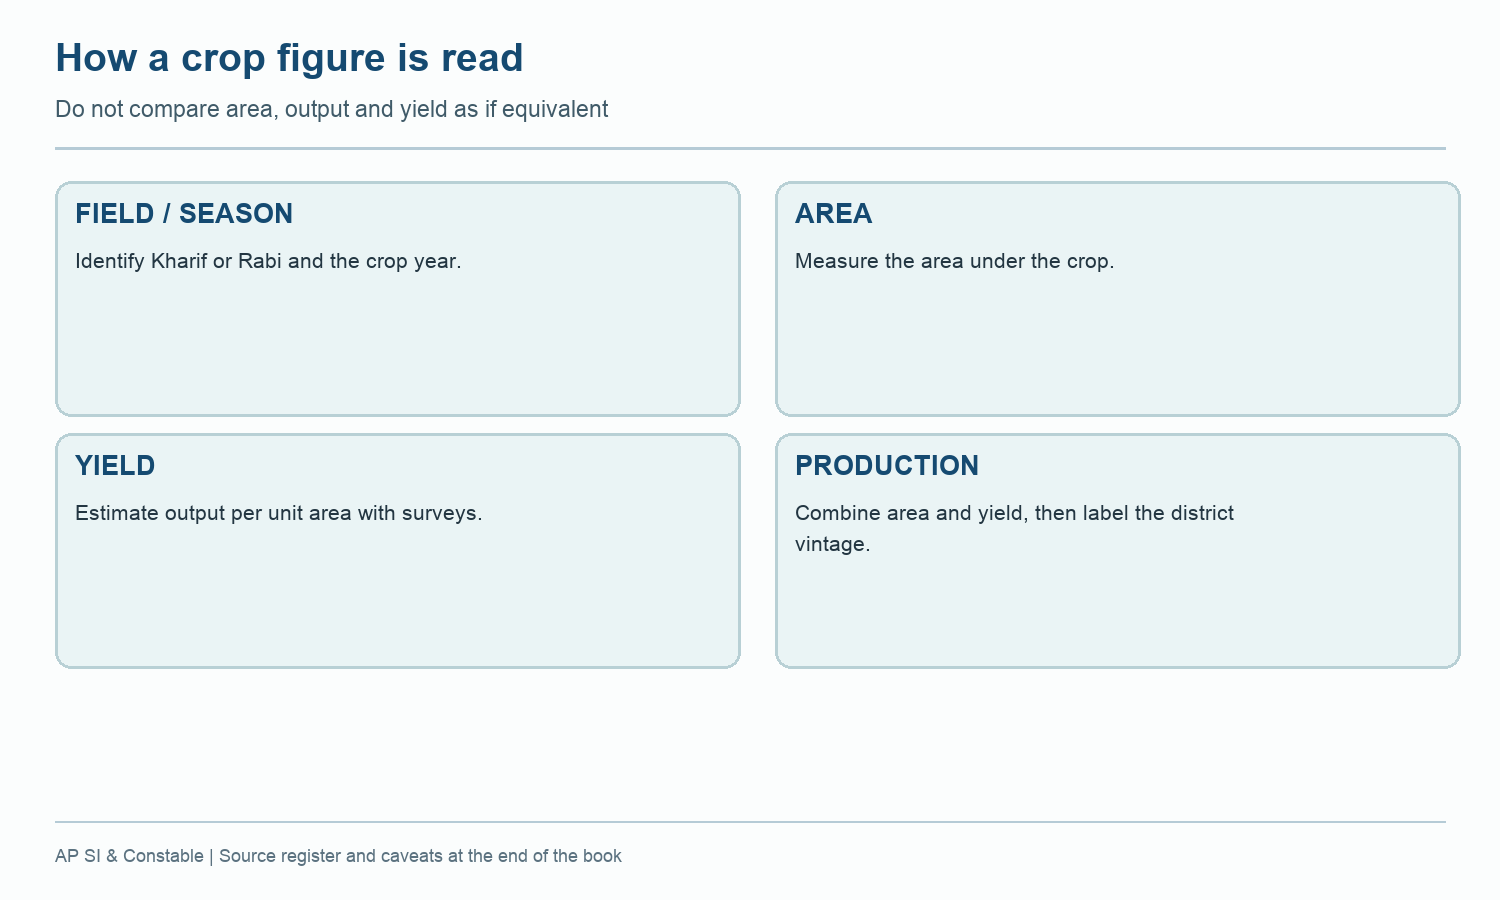
Crop statistics chain
Area and yield produce estimated output, with date and district-vintage caveats.
Read this visual
A crop estimate combines area, sampled yield and output for a dated season. Recheck units and district vintage before ranking places.
Current district geometry: APSDMA. Crop and irrigation claims: credited agriculture and water-authority sources.